This overview gives a general description of the top Forex indicators suitable for investors and traders: both newbies and professionals. In this article, you will find multiple indicators for scalping, intraday, and long-term trading strategies; for trending and flat markets. Each section contains a link to the detailed description of the indicator with the explanation of buy and sell signals, as well as examples of practical application.
The article covers the following subjects:
- What is a Trading Indicator?
- Trading Indicators Categories
- Forex Indicators Types
- Trend Following Indicators
- Oscillators
- Volatility Indicators
- Volume Indicator
- Entry indicators
- Forex price extremes indicators
- Best Indicators for Day Trading
- Best Indicators for Stock Trading
- Best Indicators for Swing Trading
- Best Indicators for Option Trading
- Best Indicators for Scalping
- Best Indicators for Crypto Trading
- Best Forex indicators: Summary
- FAQ on Forex Trading Indicators
Technical indicators can be divided into two major groups:
- Custom Forex Indicators. Custom technical indicators are originally written in the programming language by individual Forex traders. These technical tools are designed for specific tasks or individual trading systems. There are several thousands of custom indexes, and every year there appear new tools or old versions are upgraded.
- Standard Forex Indicators. Standard indicators are the basis of technical analysis. They are considered the best tools since standard technical indicators have been tested and brushed over several decades of application in the commodity, stock, and foreign exchange markets. Technical indicators are the basis for most beginner Forex trader strategies, which are explained in textbooks, trader blogs, tutorials, etc. MT4 includes 30 standard indicators of technical analysis; MT5 – 38. There are more than 60 technical tools in the LiteFinance terminal, and the developers constantly add new tools to the indicator list.
Important! After you read about an indicator, click on the link and go to its full overview and open the Forex trading chart with online indicators at the same time. Try any trading tools you read about in practice. This way, you will better understand a trading tool and learn how to spot buy or sell signals visually in order to manage personal finance efficiently.
What is a Trading Indicator?
Technical analysis analyzes statistical trends gathered from trading activity, such as price movement and volume, to forecast future price moves and evaluate trading opportunities.
Components of technical analysis:
Trading indicators. They are algorithms based on mathematical analysis and formulas, which calculate price values for a particular period. Based on these data, technical ones project the average price in the future.
Levels, trend lines. These are strong levels where a correction could start, or the overall trend could reverse. These levels can also serve as the consolidation zone borders. Such levels also include support and resistance levels (S/R levels), which could be horizontal, diagonal, dynamic, and Fibonacci levels. The nature of the levels is also of a psychological nature, which is taken into account in Forex market predictions.
- Patterns. These are technical indicators with recognizable price chart formations that often reoccur. There could be candlestick patterns also. Patterns usually signal either the continuation or the reversal of the trend.
An important element is also the mathematical analysis of the Forex trading pattern.
Fundamental analysis is a method of forecasting future prices by economic, financial, and political factors, news, force majeure.
Components of fundamental analysis:
- Macroeconomics. Economic indicators: interest rate, GDP, inflation, employment, industrial production, etc.
- Microeconomics. Financial reports of individual companies, production level forecasts, new directions and developments, management, financial analysts’ opinions.
- Geopolitical factors, force majeure, and so on.
As an example of fundamental factors, we can list US Non-Farm Payrolls, Fed’s announcements, and the demand-and-supply ratio of a particular asset. You can read more about Fundamental analysis here.
The difference between technical and fundamental analysis is in the principles and approach to forecasting. Technical analysis is built on mathematical formulas, models, and a search for patterns in the past using technical indicators. Fundamental analysis takes into account economic reports, news, etc.
How Technical Analysis Indicators Work
Technical Analysis (TA) uses combinations of technical indicators that are applied to forecast the market trend, pivot points, set stop loss, and take profit levels.
Technical analysis is based on a few principles:
- The market is cyclic. The economy develops according to the wave theory; there is a top and a bottom, there is an increase and a decline. Cycles could have different lengths, but the fundamental factors of each of the cycle stages allow predicting the future price trends.
- Events repeat. The consequences of these events also repeat. If you can find regularities, it is possible to predict the result in the future, based on the past.
- Prices are affected by all factors. Demand, economic data, expectations of the market participants – all these factors are already priced in the quotes of an asset.
Technical analysis is based on mathematical, statistical methods and the search for patterns. Forex traders react typically to repetitive factors — their behavior can be predicted based on statistics.
It is necessary to analyze mathematical and technical factors for several reasons:
Using methods of mathematics and statistics, historical data are analyzed, that derive from the study of technical indicators. Regularities are found based on grouping and averaging. Mathematical and behavioral models are built to predict the future actions of the majority.
The use of mathematical algorithms allows you to filter out the price noise and determine the general, averaged values of trade volumes, amplitude, and frequency of price moves for particular time frames.
- Algorithms based on mathematical and statistical analysis generate signals to perform a particular market action: enter or exit a trade, place pending orders, taking a long or short position. The signal also indicates the overbought or oversold conditions of the market, allows you to measure the overall trend strength, and so on.
Based on technical indicators, Expert Advisors are developed, those being automated trading systems that enter trades according to the set algorithm. Hedge funds are gradually introducing new trading systems based on trained neural networks, LSTM models that can find the most favorable solution based on input statistics and the desired output.
Trading Indicators Categories
Indicators come into two major categories, lagging and leading. Lagging compare the current price values with the previous period. They send a signal when the trend trading has already started.
Example. There should be an uptrend, as the current price reaches higher than the highs over the last 15 candlesticks. A Simple Moving Average is the average price for the last 15 candlesticks. The price change only at the last candlestick compared with the previous 14 ones has little effect on the MA reading. Therefore, the trend has already started, but the MA doesn’t signal it. This is the lag, the indicator will signal a new trend when it is already obvious.
Leading indicators change along with the price and, according to certain criteria, can help predict further price moves.
Lagging indicators are conservative, they do not send early buy or sell signals. They are more accurate than the leading ones. However, by the time there is a signal, you could have missed half of the trend. Therefore, lagging indicators are more often applied in longer timeframes starting from H1 and longer. This way, even if you have missed some part of the trend, you could still gain 20-50 pips or more. Leading indicators are more efficient for short position traders that make short corrections or prefer scalping.
Let us explore each category in more detail.
Leading Indicators
Leading indicators are among the best technical indicators which provide information on the overall trend, its strength, potential reversal before the price confirms the signal. Leading indicators send an early signal about the economic cycle and are considered efficient trading tools that can be an alert for a profitable trading entry.
Most oscillators are classified as leading indicators. If an oscillator is near the borders of the trading range, the trend may reverse soon. Conversely, if the oscillator left the border zone and went to the opposite border, this is a likely signal for the beginning of a strong trend and a potential trading entry.
Another early signal of Forex trading indicators is regular divergence. If the price chart and the index go in the opposite directions, the price could soon reverse, following the trend.
Lagging Indicators
Lagging indicators provide the information calculated based on the data for the previous and the current periods. These tools give an idea of historical data for a certain period. A lagging indicator follows the price action, not goes ahead. An example of a lagging indicator is Moving Averages.
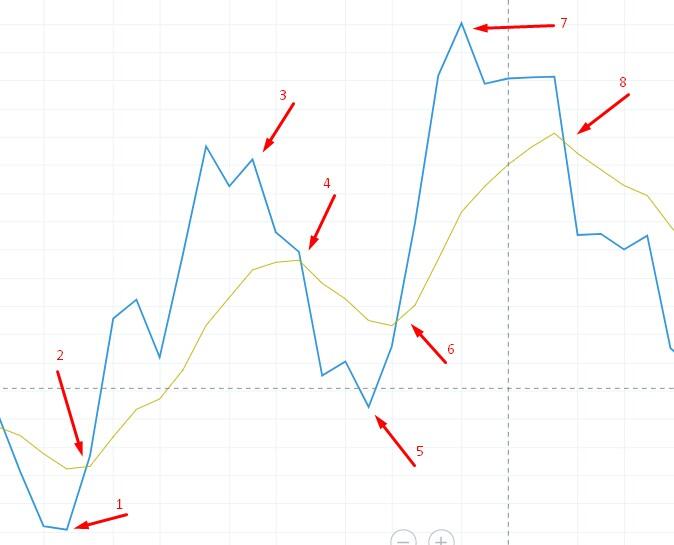
The price chart (blue line) reverses at points “1”, “3’, “5”, “7”. The EMA indicator (yellowish line) also reverses following the price action, but a little later, at points “2”, “4”, “6”, “8”.
Although trend trading indicators are often lagging, while oscillators are leading, a lot of trading strategies are based on trend ones. Oscillators are used to confirm the signal. This is because Forex traders should first determine the beginning and the direction of the trend. Signals sent by lagging indicators are considered to be more reliable because they analyze historical data together with the current price movement.
Forex Indicators Types
Technical analysis indicators can be grouped according to several parameters:
Price movement nature:
Trend following Forex indicators. These tools help to identify the start and the beginning of the trend. They are used to determine the market state – flat or trending. Trending indicators are used in wave strategies, they help to distinguish between correction and trend.
- Oscillators. They do not indicate the direction of price moves. Oscillators indicate the overbought and oversold zones (O/O zones), helping to determine where the pivot point level is.
Time of the signal relative to the price:
Lagging Forex indicators. The indicator signals come following the price action. The current price value first appears in the chart. It is calculated based on the price and displayed in the chart sometime later.
Leading indicators. These tools help to evaluate the potential strength of the trend.
Forecasting indicators. They are thought to be the best trading indicators that look for patterns in particular intervals of previous periods, after which they display the most probable price movement for the next few candlesticks.
Scope of application:
Channel Forex indicators. These tools build price channels, where the price is moving most of the time.
Volume indicators. They indicate trade volumes for a particular period.
Levels indicators. These indicators can build important levels, which are not visible in the chart.
Pattern indicators. Pattern Forex indicators are designed to spot the chart patterns that have already formed or just started forming and are not visible in the chart yet.
Divergence indicators. They help to discover a divergence. Read more about regular divergence and convergence in this article.
Volatility indicators. These tools indicate the current volatility of the asset price relative to the previous period.
Scalping indicator. They are used for quick market technical analysis in short timeframes.
- Information indicators. They show the level of the current spread, divide the chart into sessions, and display trading rane statistics.
Type of visualization:
Arrows. They mark the signal candlestick with a dot or an arrow.
Attached to the chart. In the basic version, they are displayed directly in the chart.
Displayed under the chart. In the original version, such tools are located under the trading chart.
Algorithm complexity:
Simple indicators are based on a single formula.
Combined Forex indicators are based on several indicators’ formulas.
Trend Following Indicators

Trend following indicators identify the beginning and the end of the price rise or fall and alarms traders for a potential trading entry. Trend indicators can be lagging and leading. They indicate the direction of the price trend and its strength. Trend following tools are often applied as primary indicators in all types of strategies, day trading, medium- and long-term trading strategies. Trend tools are not the best trading indicators when the market is trading flat; they are rarely used in scalping or short-term swing trading.
Examples: Moving Averages, TEMA, Alligator, Parabolic SAR.
Moving Averages
Category: lagging
MA, EMA is an indicator that calculates the average price values for the period specified in the settings. The average price for each previous period will have less and less weight. Moving Averages are used for the price forecasts and creating different trading strategies. When MAs are applied in the trading systems, Forex traders estimate the price deviation from its average value, which confirms the trend direction, inclinations angle, and average price location relative to the MAs.
SMA calculation formula (Simple Moving Average)
SMA = SUM (Close (i), N)/N
N is the period, the number of candlesticks analyzed, you specify in the settings. Close(i) is the closing price of each candlestick in the sequence. In MA settings, you can also specify other types of prices.
A simple moving average is the arithmetic mean. The modifications of moving averages are EMA, WMA, LWMA. Their calculation formulas are different as different periods have different weights, depending on the candlestick number in the sequence, trading volumes, and so on.
EMA calculation formula:
ЕМА(i) = k * P(i) + (1-k)*ЕМА(i-1)
k is the weight coefficient, taking into account the smoothing period. Р(i) is the current price.
Example of application:
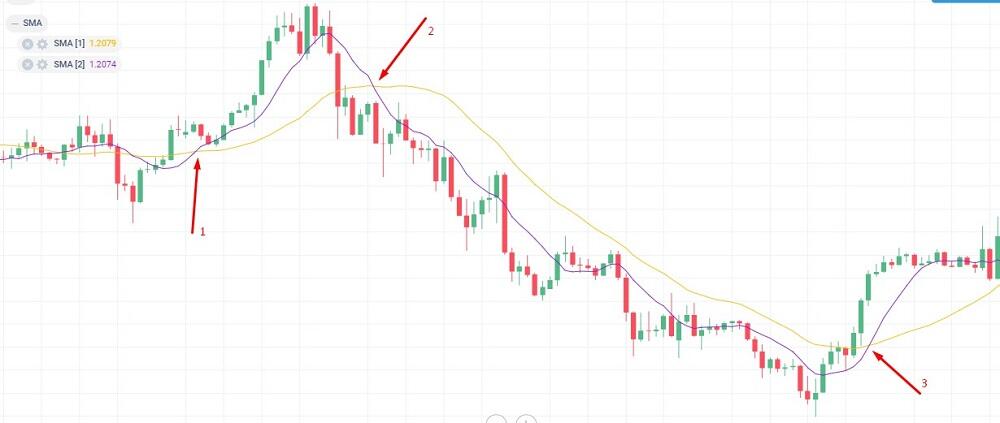
Signal: the fast (blue) MA crosses the slow one (yellow); both MAs are clearly directed up or down. At points “1” and “3”, the blue MA crosses the yellow one to the upside, so the trend is up. At point “2”, the fast MA crosses the slow one to the downside, the trend is down.
The MA indicator is suitable for:
Day trading, medium- and long-term trading strategies. Because of lagging, there are quite many false buy and sell signals in scalping and strategies based on fundamental analysis.
Timeframes from М15-М30 and longer. The MA is a frequently used indicator to analyze the long-term market trend in daily and weekly intervals.
- Any trading assets. MAs are most often used in trading currencies on the Forex market as well as securities.
Moving Averages are among the best indicators for beginner Forex traders. The calculation formula is simple, the interpretation of the signals is straightforward. Try various parameters for different types of MA, and you will understand how to develop and optimize simple trading systems.
Triple EMA (TEMA)
Category: leading.
TEMA is a modification of the exponential moving average. The Triple Exponential Moving Average incorporates EMA and a double exponential moving average (DEMA). It is an alternative to the common ЕМА in trend following trading strategies, as the TEMA reduces the influence of lagging.
TEMA calculation formula:
TEMA(i) = 3*EMA(i) – 3*EMA(EMA(i)) + EMA(EMA(EMA(i)))
Example of application:
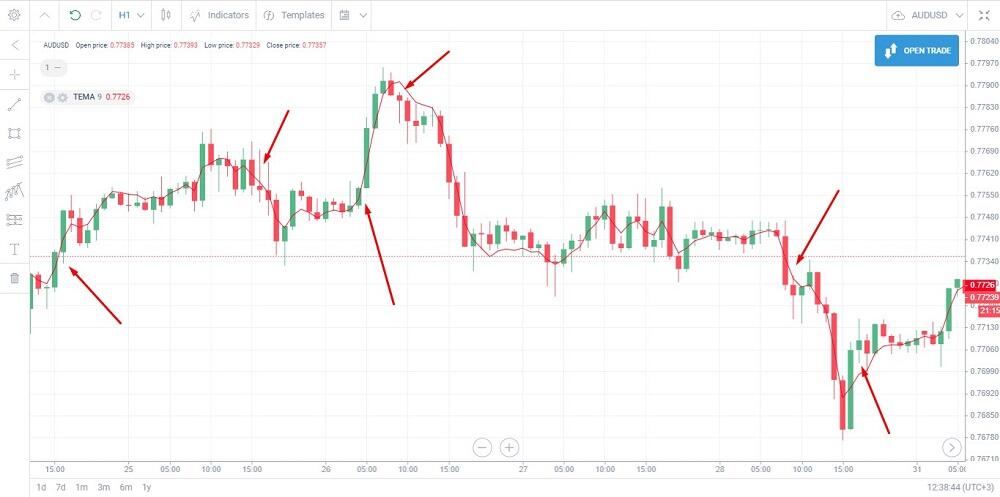
The signal of the trend appears when the price reaches and crosses the TEMA line and stays above/below it. If two consecutive candlesticks close above/below TEMA, you can enter a trade in the direction of the up/down trend. When the settings are optimized, the signals are 80% profitable.
The TEMA indicator is suitable for:
- Trend following strategies, counter-trend trading, swing trading, long-term forecasts. It is rarely used in scalping.
- Timeframes of H1 and longer. Rarely used timeframes are М15-М30.
- Any trading asset: Forex, stocks, commodities, cryptocurrencies.
The TEMA is among the top Forex indicators for most traders that are interested to use such tools as all types of moving averages or Alligator. The TEMA fits well with oscillators.
Parabolic Stop and Reverse (Parabolic SAR)
Category: lagging
The Parabolic SAR is used by several Forex traders to determine good entry points and pivot point levels. The signal's interpretation is similar to moving averages. If the Parabolic SAR dots are below the price, the trend is up. An additional signal: the shorter the distance between the dots and the price, the faster the trend is, and the more likely the trend is to reverse. Check advanced Parabolic SAR settings in our blog.
Calculation formula:
PSAR(uptrend) = (Н(i-1) - PSAR(i-1))*AF + PSAR(i-1)
PSAR(downtrend) = (L(i-1) - PSAR(i-1))*AF + PSAR(i-1)
H stands for high. L – for low; (i-1) is the previous candlestick
AF is the acceleration factor. The start value is 0.02, which increases with each next candlestick.
AF = 0,02 + Х*k
X is the number of periods, k is the step of the price change.
Example of application:
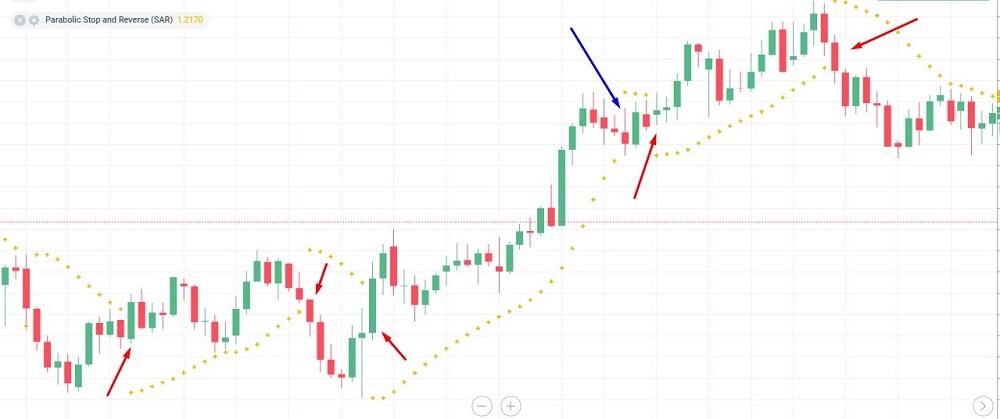
It is clear from the screenshot that Parabolic SAR sent a false signal only once, it is marked with a blue arrow. In other cases, the trend direction is forecast accurately. It is also clear that Parabolic SAR lags by 2-5 candlesticks.
Parabolic SAR is suitable for:
- Trend following, counter-trend medium- and long-term strategies. The Parabolic SAR developer recommends employing the indicator for trading strategies that are 1-2 weeks long. It doesn’t work when the market is trading flat.
- Defining the levels for stop loss and take profit.
- Timeframes of Н1-Н4 and longer.
- Forex market, commodities, securities, stock indexes, cryptocurrencies.
The indicator is suitable for beginner Forex traders because the buy and sell signals are easy to find and interpret. It will also be of interest to experienced traders who use a trailing stop.
Ichimoku cloud
Category: leading
The Ichimoku cloud (Ichimoku Kinko Hyo) is used to gauge the price momentum together with the price volatility changes. The Ichimoku Kinko Hyo is composed of five lines that make up ranges- clouds. The lines themselves, according to the principle of analysis, are compared with moving averages. The Ichimoku indicator is used to identify the trend, define the support and resistance levels, entry and exit price zones.
Ichimoku calculation formula:
Tenkan-Sen: (Max(High,N)+Min(Low,N))/2
Max and Min are extreme price values for the period N specified in the settings.
Kijun-Sen: (Max(High,M)+Min(Low,M))/2
Max and Min are extreme price values for the period M specified in the settings.
Senkou Span A: (Tenkan-Sen+Kijun-Sen)/2, projected ahead by period M.
Senkou Span B:(Max(High, Z)+Min(Low, Z))/2, projected ahead by period M.
Max and Min are extreme price values for the period Z specified in the settings.
Chikou Span is the current Close projected back by period M.
Example of application:
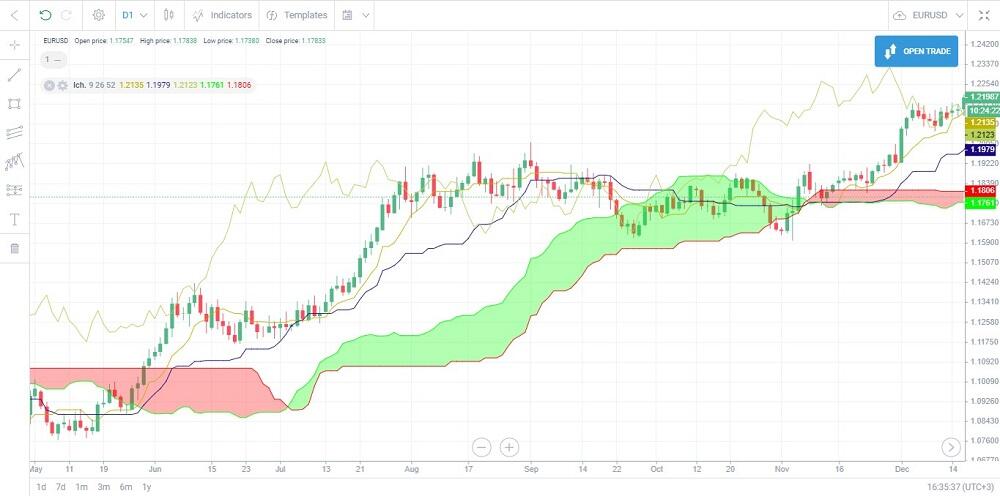
The indicator lines form ranges – clouds. If the price reaches below the clouds, the trend is down; if it is above the clouds, the trend is up. The green cloud means the potential continuation of the uptrend; the red one – the downtrend could continue. Senkou Span lines serve as key levels, which can be used in the breakout strategies or for setting stop losses.
Several Forex traders prefer the Ichimoku cloud for:
- Trend following strategies in the highly volatile markets.
- Timeframes of H1 and longer. Ichimoku is one of the best trading indicators for long-term trends in the daily timeframes. It could be employed in the minute intervals for scalping trading, but are quite rare.
- Ichimoku is most often applied on Forex market.
For experienced traders, the Ichimoku cloud is one of the best indicators for Forex trading. Traders should be able to quickly discover and interpret the signals at multiple lines and ranges together with the price location. Therefore, the toll could be a bit complicated for a beginner technical or fundamental analyst.
Alligator Indicator
Category: lagging
The Williams Alligator indicates entry points when there starts an impulse movement. The Alligator indicator is composed of three moving averages with different periods and shifts. When the lines simultaneously go apart, there could start a new trend. When the indicator lines meet, the trend should be exhausting. When the lines are interwoven or move horizontally close to each other, the market is trading flat.
Calculation formula:
Median Price (МР) = (High+Low)/2
Other technical indicators most often analyze the Close Price. The Alligator employs the median price, calculated as the arithmetic mean of the high and the low.
The Jaw line: Smoothed МА (МР, 13, 8)
The Teeth line: Smoothed МА (МР, 8, 5)
The Lips line: Smoothed МА (МР, 5, 3)
Example of application:
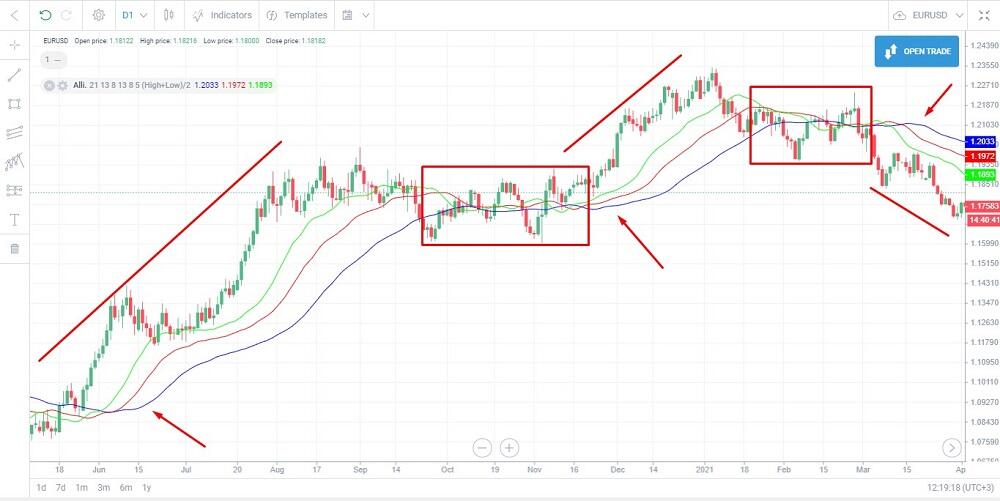
The arrows mark the points where MAs go apart. With a slight lag, the regular divergence of the lines shows a clear trend. The points where the lines meet or interweave are marked with red boxes – the market is trading flat with equal price moves in both directions.
The Alligator is suitable for:
Trend following strategies. Alligator signals a flat when the lines meet and the start of the trend – when the lines go apart.
Determining the beginning and the end of a trend. It accurately shows when the trend is about to start.
Timeframes of H1 and longer. Due to the lag, the Alligator is not very effective in the timeframes shorter than H1.
- Trading on Forex market.
Alligator is one of the best indicators for Forex trading. It is suitable for beginners using intraday, medium- and long-term strategies. A simple combination of MAs with different periods accurately identifies the trend.
KDJ
Category: lagging
KDJ is a technical indicator used to determine the strength and direction of the trend. KDJ is composed of three lines with different periods, located under the trading chart.
Calculation formula:
К = KFactor * PrevK + DFactor * RSV
RSV = ((Close – Min low) / (Max high – Min low)) * 100
D = KFactor * PrevD + DFactor * K
J = 3 * D - 2 * K
Max high and Min low are price extremes for a period specified in the settings. KFactor, DFactor are factors specified in the settings.
Example of application:
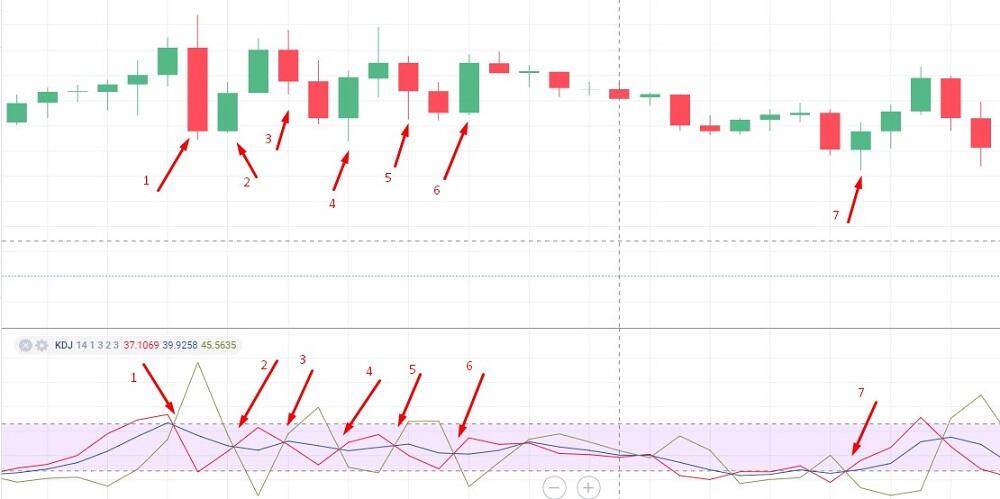
The signal appears when all three lines cross. A buy signal: the red line is above the blue, and the blue one is above the green. A sell signal: The red line is below the blue, and the blue one is below the green. The farther the lines are from each other, the stronger the signal is.
It is suitable for:
- Trend following strategies; day trading, medium- and long-term strategies. It doesn’t work when the market is trading flat.
- For timeframes of H1 and longer.
- For any trading asset, except for cryptocurrencies.
The KDJ will be of use for most traders using trading systems, based on trend following indicators, oscillators, and Price Action. It is considered as the best technical indicator to combine well with the Alligator and the stochastic one.
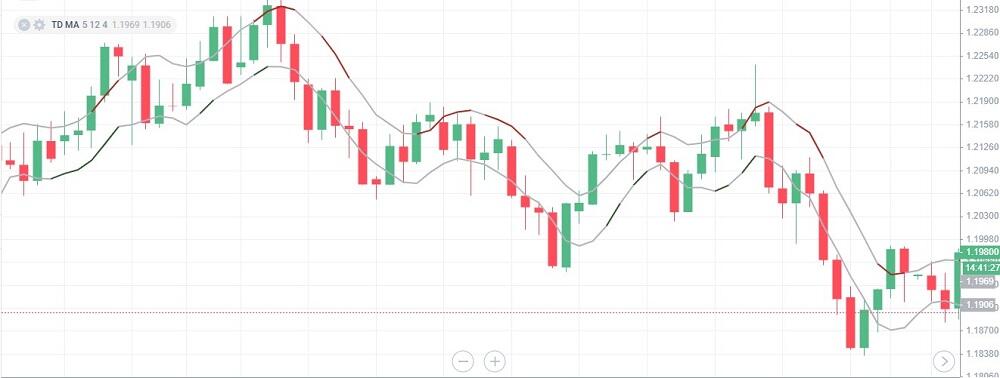
TD Sequential indicator
Category: lagging
TD Sequential is one of the top Forex indicators used to spot the end of local trends and determine pivot points. This forecasting trading tool consists of three elements:The first element is Price flip, a pattern composed of six candlesticks that signal a potential reversal. The second element is Setup, a pattern composed of nine candlesticks. At this stage, the indicator identifies whether the Price flip is a trend reversal or just a correction. The third element is CountDown which is composed of 13 candlesticks. It counts the candlesticks from the start of the new trend to the new reversal, Price flip. The indicator counts only the candlesticks that meet certain requirements.
Calculation formula: The indicator compares the closing prices of the current candlestick with the previous ones according to a specific algorithm that differs for each of the three indicator elements.
Example of application:
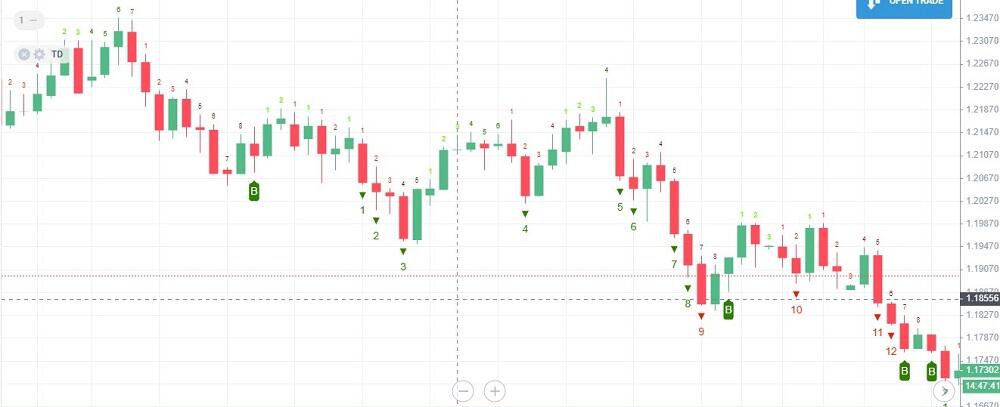
The indicator divides the chart into three parts, each differently marked: large numbers under the candlesticks, small numbers above the candlesticks, reversal patterns.
It is suitable for:
- Japanese candlestick charts. The indicator will work only on candlesticks or bars.
- Trend following long-term strategies, which include Price Action elements. The trading range of the indicator, including all three elements, is at least 25-28 candlesticks. It sends very rare signals.
- Timeframes of H4 and longer. In shorter timeframes, there are many incomplete patterns interrupting the indicator working procedure.
- Currency pairs, cryptocurrencies.
It is one of the best indicators if you are a professional Forex trader that can combine complex knowledge of personal finance and can spot reversal patterns in order to understand mathematical formulas of complex indicators.
TD Moving Average (by DeMark)
Category: lagging
TD Moving Average (by DeMark) is an advanced version of the Moving Average used to define the market trend. The indicator determines the ongoing trend and can be used to detail the levels to set trailing stop, entry, and exit points.
Calculation formula: The indicator compares the highs and lows of the current candlesticks with the previous ones and draws an upward or downward trend based on the forecast.
Example of application:
This combination is considered to be one of the best Forex indicators, drawing a price range, based on the MAs.
TD Moving Average is suitable for:
- Trend following medium- and long-term strategies.
- Currency pairs and cryptocurrencies. Less commonly, it is used for stocks and indexes.
- Timeframes of H4 and longer.
It is recommended to professional traders who understand the algorithm of the indicators signals formation.
Coppock Curve
Category: lagging
Coppock Curve is a trend indicator, based on the moving average, fast and slow oscillator lines of the ROC indicator. The indicator can look like lines or a histogram.
Calculation formula:
CC = WMA (ROC(s) + ROC(q))
WMA is the weighted moving average. ROC is the Price Rate of Change indicator; its formula is covered in the section devoted to oscillators. ROC(s) and ROC(q) are slow and fast oscillators.
Example of application:
In the chosen currency pair chart the when the signal offers: averaged weighted values of the indicators start rising, the market is trending up. If the values are lowering, the trend is down. It is clear from the screenshot, the Coppock Curve accurately shows the trends, appearing short-term, that could last for 7-14 days in the daily timeframes.
The Coppock Curve is suitable for:
Long-term strategies. According to the recommendations of the Coppock Curve developer, the indicator is applied to the search of long-term trends in monthly charts, for which the default settings are adjusted.
Timeframes D1-MN.
- Currency pairs, stocks that have clear long-term trading ranges. It is often used to trade Forex as well as exotic pairs in the market.
The Coppock Curve will serve well to long-term investors’ trading plan, applying strategies with an investment horizon from 1-2 weeks to a month or more.
ZigZag
Category: complementary
ZigZag is an additional, complementary trading tool, which connects important extremes in the price chart, ignoring short, random price moves. It doesn’t predict the future price movement, indicating important price changes in the past. The shorter the period is, the more zigzags are on the indicator.
Calculation formula: the algorithm of the search for candlesticks’ highs and lows, according to the deviation, the number of candlesticks between the extremes and the period.
Example of application:
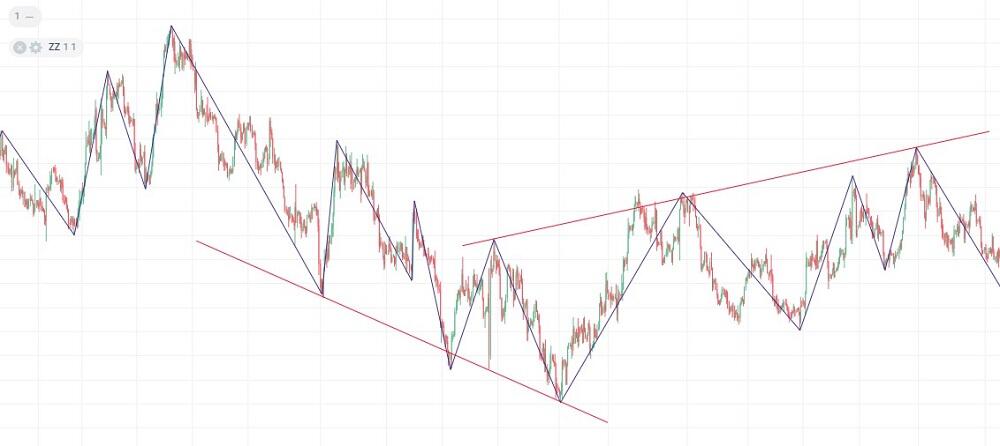
It is applied to identify the trend and build support and resistance levels. It also helps to discover technical chart patterns.
The ZigZag indicator is suitable for:
Medium- and long-term trading strategies. Trading systems based on the Elliott wave theory. For analyzing trends in longer timeframes to further trade in shorter timeframes. It is well combined with channel indicators.
Timeframes of H4 and higher.
- Any trading assets, like a currency pair, cryptocurrencies, or stock derivatives.
The ZigZag indicator will be suitable as a complementary tool for any Forex trader, who carry out long-term trend analysis.
Oscillators
Momentum indicators and oscillators are technical tools that measure the rate of the price change over a specified period. Such types of tools define whether the bullish or bearish volumes dominate. They often have values ranging from 0 to 100. If the indicator moves closer to the range border, reverses, and goes towards the median value, the trend could be exhausting, and the market could start trading flat. They refer to technical tools used to confirm or detail signals; they can be leading or lagging, depending on the indicator category. These tools perform well in range markets.
Examples: stochastic oscillator, Relative Strength Index, CCI, Momentum.
Momentum Indicator
Category: leading
Momentum is a technical indicator used to measure the rate of the price change over a specific period. It is based on the idea of a sharp price rise/fall at the moment of the trend final stage. If the price is rising, more people will be willing to buy an asset with each new candlestick. The stronger the price fall is, the more people will be willing to sell. If the oscillator is close to highs/lows, the trend should continue in the short term. If the signal line reverses at the high/low, the trend should also reverse.
Calculation formula:
MOMENTUM = Close(i)/Close(i-n) * 100%
Close(i) is the current candlestick closing price, Close(i-n) is the closing price n candlesticks ago.
Example of application:
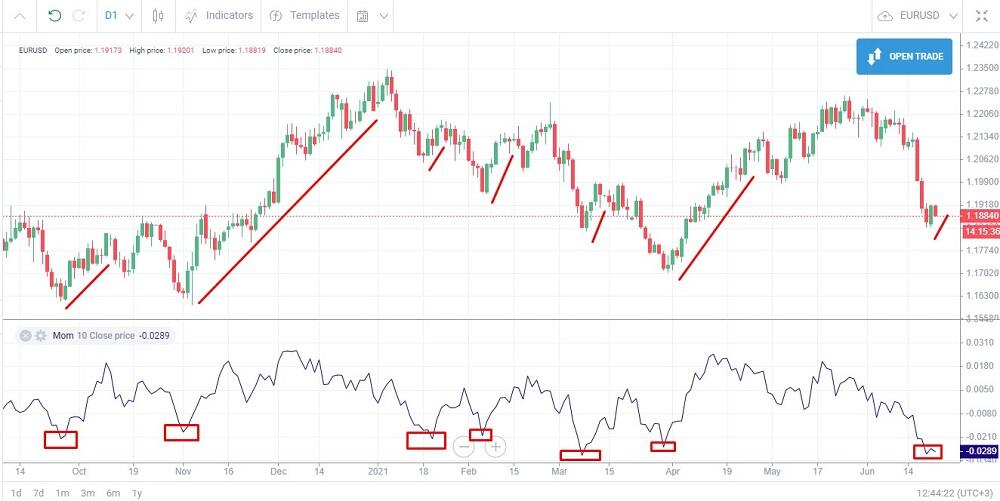
The signal is formed at the price extremes. For the chosen period of the currency pair, when the oscillator has made a bottom, it is time to set a buy order; if the oscillator makes a top, one should set a sell order. The screenshot shows that the indicator sends accurate buy signals in the daily timeframe; the top signals the trend end. In general, the indicator spots short price movements of 3-5 candlesticks, so it performs the best in the daily timeframe.
Momentum is suitable for:
- Trend following, intraday, medium- and long-term trading strategies. It is less commonly used in scalping.
- Any timeframe.
- Any assets: currency pairs, cryptocurrencies, stocks, and commodities.
It is one of the best day trading indicators for beginners, who need to spot in an easy way an efficient trading entry. The momentum has a simple, straightforward formula, it fits well with trend following indicators.
Stochastic Oscillator
Category: lagging
The Stochastic is an oscillator that measures a particular closing price of a security to a range of its prices over a certain period. The indicator line moves between values 0 and 100. When the range fluctuates from 20 to 0 the asset is considered oversold, while when it exceedes the upper band from 80 to 100 then it is in the overbought zone. When the stochastic indicator is within one of the zones, it may mean a soon trend reversal. The Stochastic is used to identify the beginning of the new trending movement, pivot points, search for local highs/lows, divergences.
Calculation formula:
%К (primary line) = (Close - Min(n))/(Max(n) - Min(n))*100%
%D (additional line - signal, dotted) = SМА (%К, n)
Close — closing price of the current candlestick, Min(n), Max(n) — low and high over a period specified in the default settings, SMA — simple moving average.
Example of application:
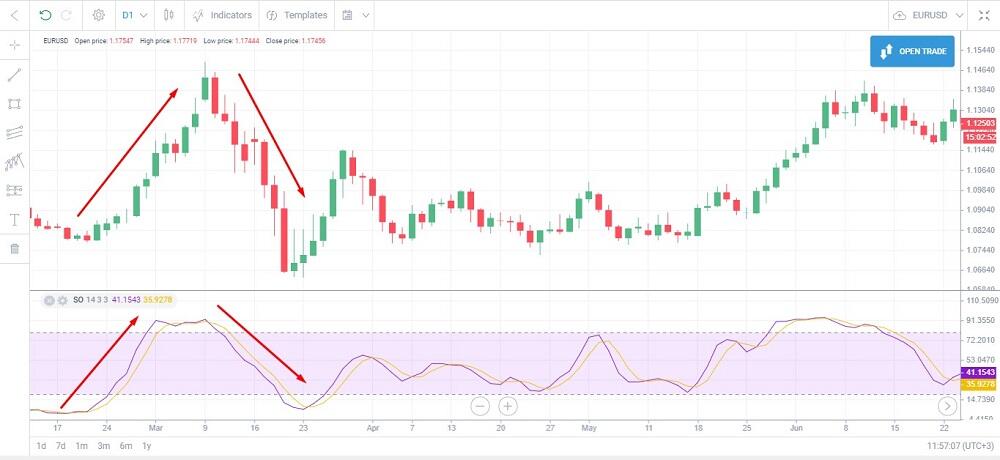
For the EURUSD currency pair the stochastic is following the trend. The indicator reversal in the overbought zone means the end of the strong, trending movement, which could be followed by the trading flat or the trend reversal.
Stochastic is suitable for:
- Trend following strategies, based on the signals at the trend reversal points.
- Day trading strategies based on divergence. The divergence between the price chart and the oscillator could mean the trend reversal.
- Timeframes of M30-H1. In shorter timeframes, the indicators are too sensitive to random market noises.
- Any currency pairs, stocks, and stock indexes. It is less commonly applied to trading crypto.
It is recommended to beginner traders as one of the best trading tools for Forex trading, as it is not complicated and the signals are easily interpreted. An example of the oscillator application is confirmation of the signals sent by trend-following indicators combined with other oscillators and Forex indicators such as CCI, RSI, MACD line.
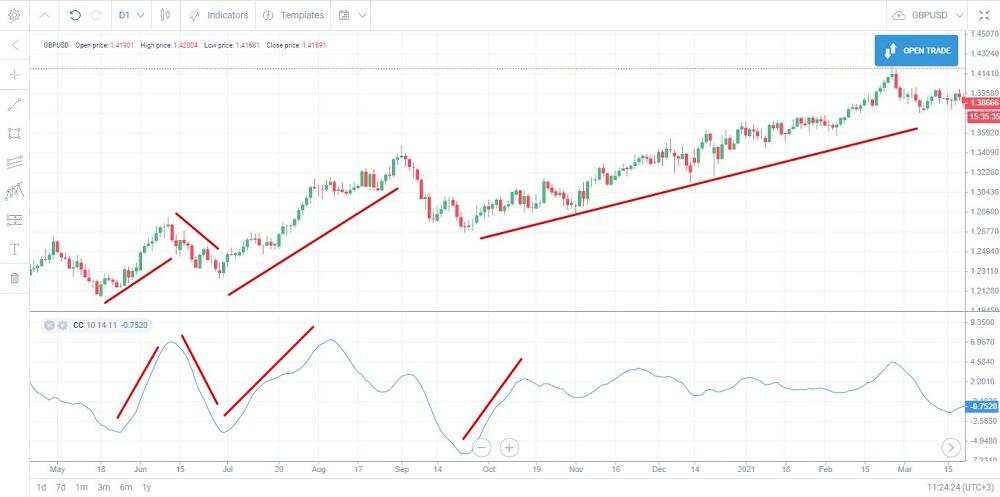
Commodity Channel Index (CCI)
Category: leading
CCI is the oscillator measuring the deviation of the current price from its average value. The indicator is moving in the range between -100 and 100. When the signal line goes outside the range, then the market is considered oversold or overbought. In this case, the steady movement towards its median value.
Calculation formula (step by step):
- Typical price (TP) = (H+L+C)/3, where H is the high of the candlestick, L is the low of the candlestick, C is the closing price of the candlestick.
- SMA (TP, N) = SUM (TP, N)/N. A simple moving average, calculated based on typical prices for the period of N candlestick. The formula for the arithmetic mean: all TPs are summed up and divided by their number.
- D = TP - SMA (TP, N). There is calculated the difference between the typical price of each candlestick and SMA.
- SMA (D, N) = SUM (D, N)/N. The calculation of the moving average of the D values.
- М = SMA (D, N) * 0,015.
- CCI = M/D.
Example of application:
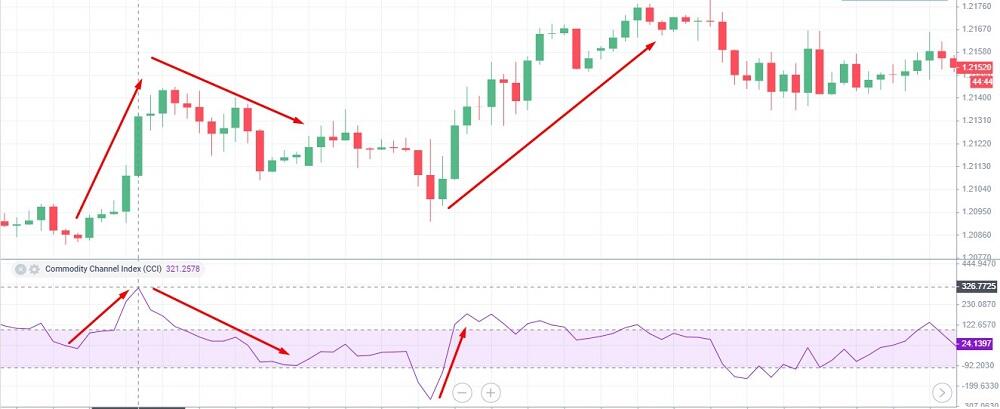
The CCI rise confirms the trend. The start of the reversal could mean the end of the trending movement. The CCI signals are not often accurate, so the indicator should be used together with other oscillators of trend following indicators.
The CCI is suitable for:
- Any types of trend following and counter-trend trading strategies.
- Any timeframes. Most commonly used in the timeframes are М30 – Н4 with different settings.
- Any trading assets.
It is recommended to use the CCI together with other popular oscillators, RSI and stochastic indicator.
Relative Strength Index (RSI)
Category: leading
The RSI is a popular momentum indicator measuring the relative strength of bulls and bears and the probability of the trend reversal. The signal line is moving in the range between 0 and 100. The closer the line is to the upper/lower border, the more overbought/oversold the asset is, and the more likely the trend is to reverse.
Calculation formula:

Calculation of RS:
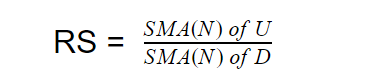
SMA stands for the simple moving average price, N is the calculation period, U and D are values obtained by comparing the prices of the current and the previous candlesticks.
Example of application:
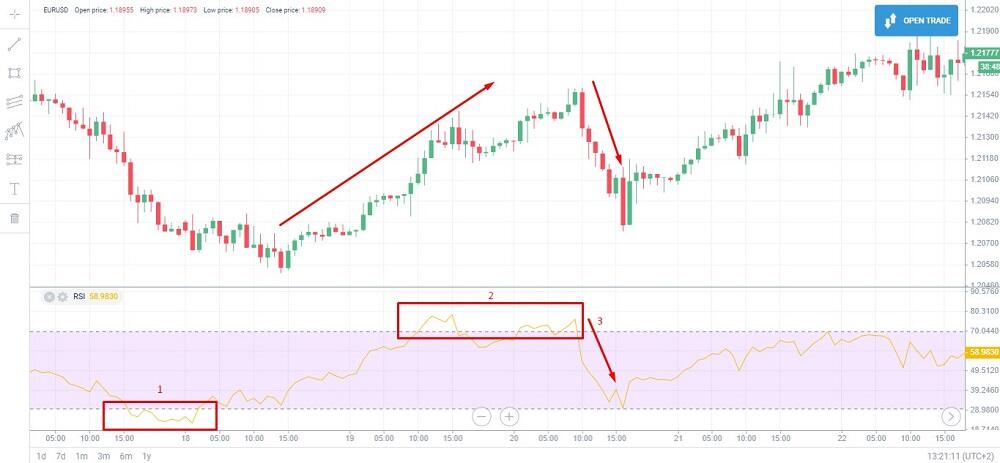
At the section marked with box 1, the Relative Strength Index has been in the oversold zone for a wide time frame, which is a signal of the trend reversal. The same situation is at the section marked with box 2, where the RSI is located in the upper band and it is considered overbought, meaning that the trend may reverse. The index goes down in section 3, which confirms the downtrend.
The Relative Strength Index is suitable for:
- Any type of assets, most often currency pairs.
- Timeframes of M30 and higher.
- Intraday trading strategies, swing trading, long-term trend analysis. Experts do not recommend using the RSI in scalping.
The Relative Strength Index will be of interest to most traders of any experience. For beginners, it is recommended to use the RSI together with the CCI.
Moving Average Convergence Divergence (MACD)
Category: lagging
MACD indicator is a popular trend following indicator of the oscillator type. It measures the degree of divergence or convergence of the exponential MAs. The tool is composed of two lines and a histogram. The primary MACD line defines the price momentum, whether it is up or down. The signal line helps to identify the pivot point level of a steady trend and provides entry signals.
Calculation formula:
MACD (primary line) = EMA (Close, SP) - EMA (Close, FP)
SP - calculation period of the slow ЕМА, FP - period of the fast ЕМА. Close — closing price.
MACD (signal line) = SMA (MACD “primary line”, P)
SMA — simple moving average, Р — period of the signal
The histogram shows the difference between primary and signal MACD lines.
Example of application:
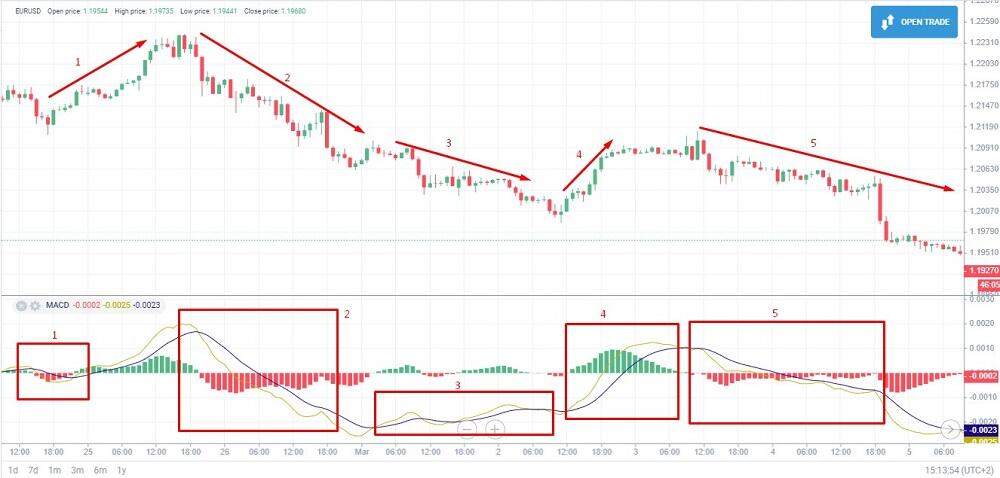
The primary and signal lines cross at sections 1-2 and 4-5, and the histogram bars are rising. If both lines are directed down, and the bars are increasing downside, below the zero line, the trend is down. For an uptrend – the situation is the opposite. The longer the bars are, the stronger the trend is. In section 3, the MACD lines converge, and the bars are small, the market is balanced.
MACD line is suitable for:
- Mostly, currency pairs, cryptocurrencies, and stocks.
- Timeframes of H1 and longer.
- Any types of trading strategies, except for scalping and trading based on fundamental analysis.
MACD line is a popular momentum indicator used by traders who are already familiar with the types of MAs and want to employ more complex tools.
Average Directional Index (ADX)
Category: leading
Another popular momentum indicator is ADX which is a combination of a trend-following tool and an oscillator. The ADX is composed of two elements moving in the range of 0% -100%. The primary ADX element displays the trend strength but doesn’t indicate the direction. If the primary indicator line is above 40%, the trend is strong. It is likely to reverse, however, the ADX line could stay at the same level after the price reversal. Additional lines +DI and -DI indicate the trend direction. If +DI is above -DI and is moving up, the trend is up.
Calculation formula:

The calculation of + DI, -DI is phased and takes into account the price True Range (TR), adjusted for the exponential MA.
Example of application:
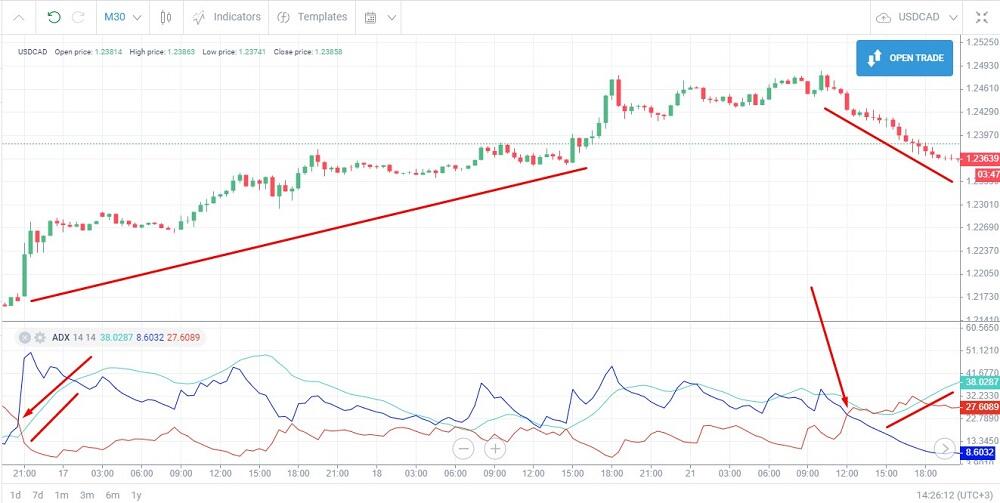
One of the ADX signals is when its two additional lines meet. In the first case, the blue DI+ crosses the red DI- to the upside, it signals an uptrend. In the second case, the blue line crosses the red one to the downside. The rising blue ADX line means the trend is strengthening, irrespective of its direction.
The average directional movement index is suitable for:
Trend following intraday, medium- and long-term strategies. It doesn’t work when the market is trading flat. The ADX sends accurate signals when the sideways trend ends.
Timeframes of М30-Н4. In the timeframes shorter than M30, the ADX sends many false signals.
- Any assets. Most commonly, the ADX is used in trading assets, such as a currency pair, on Forex market; less often – in trading commodities or stocks.
The ADX is recommended to traders with a basic and above-the-basic level of knowledge of technical analysis. The indicator has multiple lines, and there are many interpretations of the signals. Therefore, it may seem a bit complicated to newbies.
Laguerre indicator
Category: leading
The Laguerre indicator is a trend-following indicator, designed as an oscillator, whose values vary in the range of 0-1. In some modifications, there are now values limiting the range. The Laguerre indicator is used to spot micro trends and define the market cycles.
The calculation formula: the Laguerre indicator, uses spectral analysis of maximum entropy based on the Laguerre polynomials. The basic calculation principle is similar to the Relative Strength Index (RSI) formula, which is supplemented with the four-component Laguerre filter.
Example of application:
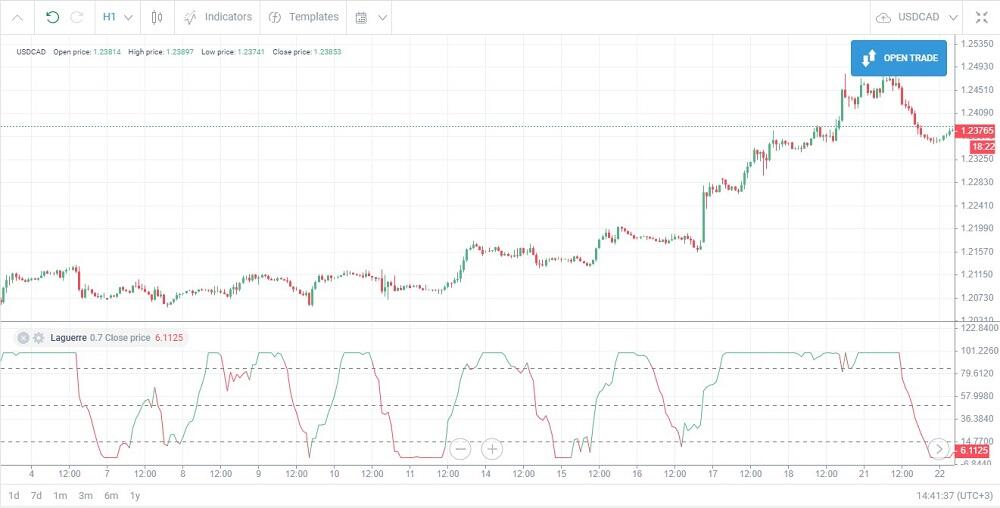
The screenshot above displays the general view of the oscillator in one of the modifications. It is clear that the indicator is quite accurately following the trend. Unlike common oscillators, this tool is difficult to interpret, according to the overbought/oversold zones. So, I recommend studying the detailed guide to understand the signals search and interpretation.
It is suitable for:
- Scalping, swing trading, with additional tools to confirm the signals. The Laguerre could serve as independent indicators in long-term trading strategies without any complementary indicators. An example of such a strategy is a system based on the fast and slow Laguerre indicators.
- Currency pairs.
- Timeframes of М5-М15 and longer.
It can be recommended to beginner traders mastering new professional tools. It also will be of interest to scalpers and swing traders.
Rate of change (ROC)
Category: leading
ROC is an oscillator measuring the rate of the price change for a specific period. When the ROC indicator is around the center line 0, the market must be consolidating. If the ROC is above the zero line, the market is bullish, if the indicator is below the zero value, the market is bearish.
Calculation formula:
ROC (N, i) = (Close(i) - Close (i-N) ) / Close (i-N)
Close (i) — current closing price. Close (i-N) — closing price N periods ago.
Example of application:
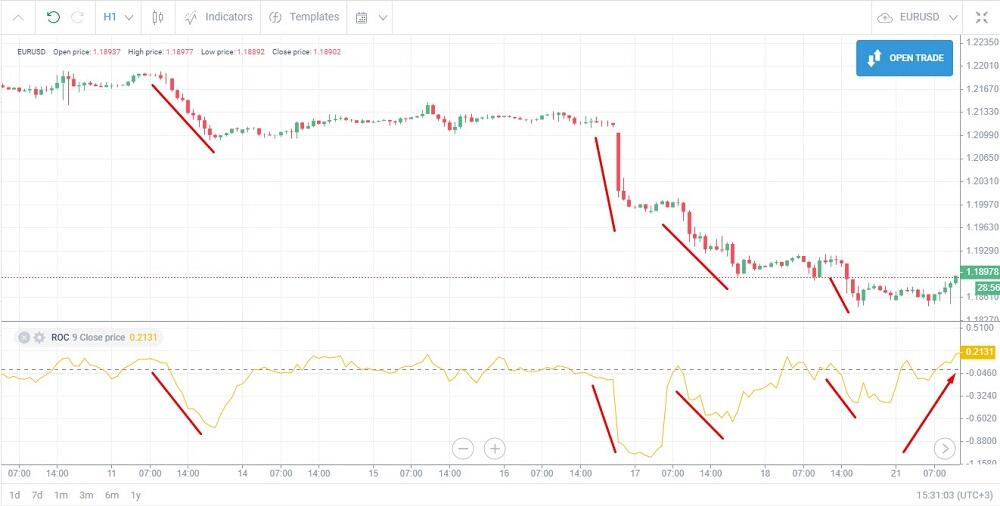
The horizontal zero line is the reference. If the ROC indicator starts moving up or down from the zero level, one could consider entering a short or long position. The above screenshot displays four signals to enter a sell trade.
The ROC indicator is suitable for:
- Intraday, medium, and long-term strategies. It is less suitable for scalping or swing trading, as there are many false signals in short periods.
- Any trading assets, including stocks and cryptocurrencies.
- Timeframes of H1 and longer.
ROC is suitable for traders of any level of skills as an additional complementary tool.
Ease of Movement Indicator
Category: leading
The Ease of Movement is among popular Forex indicators that measure the relationship between the price of a currency pair and its volume to display the result as an oscillator. The ease of movement value gauges the strength of the market momentum.
Calculation formula:
DM = (High(i) + Low(i))/2 - (High(i-1) + Low(i-1))/2
High, Low — the highest and the lowest price value ; i, (i-1) — current and previous prices.
BR = (Current Volume/D) / (High(i) - Low(i))
D - denominator, specified in the settings.
Period EOM = DM/BR
EOM = SMA (Period EOM)
SMA — simple moving average.
Example of application:
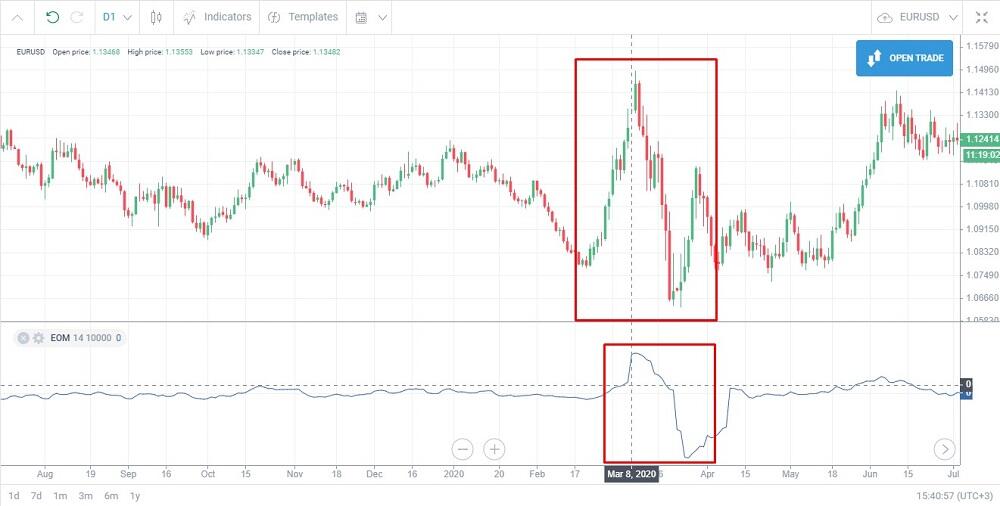
This is one of the examples of a profitable Forex trading strategy. In the daily chart, the EOM line is smoothed, moving along with the zero line. A sharp deviation up means a strong uptrend. In this case, the EOM sends signals late, but it is possible to make a profit from two or three candlesticks. Next, the indicator turns down, which is a signal to enter a trade in the opposite direction. If we switch to a shorter timeframe, we could pick up more insignificant price swings, but the quality of signals will be worse.
The oscillator is sensitive to the increase in trade volumes. The flat movement around the zero line means that the trading volumes are small, and the market must be trading flat. The higher/lower is the EOM relative to the zero line, the easier the price is moving up or down due to the increase in trading volumes.
The indicator is suitable for:
Any type of strategy, except for scalping. Like the ROC, the EOM refers to momentum oscillators, so these two tools could be used together in trading systems.
Timeframes of H1 and longer.
- Any type of asset. Fundamental analysts use this oscillator with a currency pair or in stock trading, where real trade volumes are taken into account.
Know Sure Thing Indicator (KST)
Category: leading
KST is an oscillator displaying the overbought/oversold zones, smoothed rate of change. It is based on moving averages with four periods. Thus, the short-term insignificant price swings are ignored, and strong long-term trends are identified. The indicator is moving around the central zero line, the range of movements is not limited. Signals are rare but accurate. It is often used together with trend-following instruments.
Calculation formula:
Primary line: KST=МА(ROC1, Period1)*W1 + МА(ROC2, Period2)*W2 + МА(ROC3, Period3)*W3 + МА(ROC4, Period4)*W4
Signal line = МА(KST, Period)
W is the weight coefficient specified in the settings. ROC - Rate of change, MA- moving average.
Example of application:
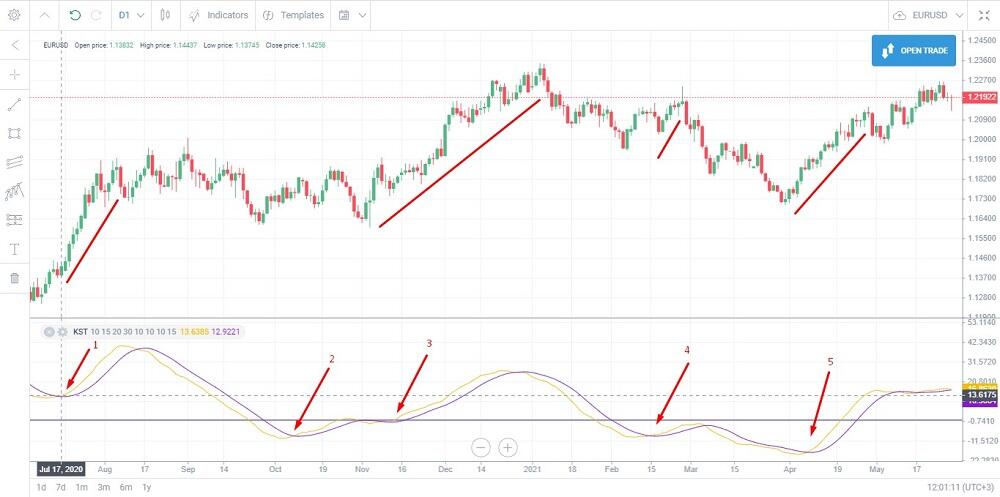
Signal to enter a long trade: primary (yellow) line crosses the signal line (blue) from the bottom up. It is preferable that the lines should cross in the negative zone. The opposite crossing of the line at the extreme points relative to the zero level means the end of a steady trend. In the screenshot above, signals 1,3,5 are winning, 2 is false, 4 is a weak signal.
The KST indicator is suitable for:
Long-term strategies. It is used to spot a strong long-term momentum and corrections. The KST performs well in trend-following strategies and long-term swing trading, thus it is not suitable for short position traders.
Long positions. It is statistically determined that the number of false signals for short positions increases sharply.
Timeframes of H1-H4. The indicator developer recommends using the MN timeframe.
- Any assets. It was originally designed for stock trading, but it performs well in the derivatives, with a currency pair, and Forex trading markets.
The KST indicator will be of interest to most traders, who prefer long-term trading systems, aiming to search trend movements and position reversal on the local corrections.
Percentage Price Oscillator (PPO)
Category: lagging
PPO is a momentum oscillator based on the relation of the EMA with a different period. The analysis principle is similar to the MACD indicator; the indicator can be displayed as two curves and a histogram under the price chart.
Calculation formula:
Primary line PPO = ((EMA(12) – EMA(26)) / ЕМА(26))) * 100
Signal line = ЕМА(9)
Histogram = primary line - signal line
Example of application:
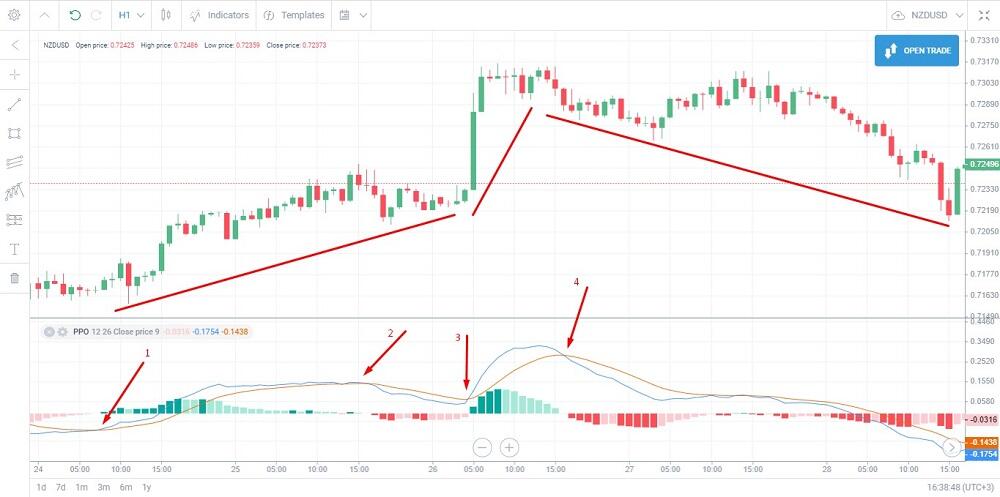
Signals: when trading with a currency pair you need to open a long position when the primary line crosses the signal line from bottom to up, a short position – from top to down. When the signal of the currency pair’s chart is stronger: for a buy trade – the lines cross under the zero line; for a sell – the lines cross above the zero line. An additional signal is the location of the histogram. A sell signal is when the histogram is in the negative zone and lowering. In the screen above, all signals, except for 2, are winning.
The PPO indicator is suitable for:
- Usual trading systems, from scalping to intraday and long-term, strategies.
- Timeframes of М15-Н4.
- Any assets. It is quite often used in trading stocks.
The RPO will be of interest to a beginner Forex trader who wants to get familiar with different types of multiple indicators. It can be replaced by the MACD indicator.
Mass Index
Category: lagging
Mass Index indicator is a forecasting range oscillator, which measures the rate of change of the highest and lowest price for a period specified in the settings. The Mass Index is used to determine pivot points. It doesn’t indicate the trend direction. The MI is most often employed in the search for exit points.
Calculation formula:MI = SUM (EMA (High-Low, 9) / EMA (EMA (High-Low, 9),9), Р)
High, Low — extreme prices for nine candlesticks. Р — period specified in the settings. EMA — exponential moving average.
Example of application:
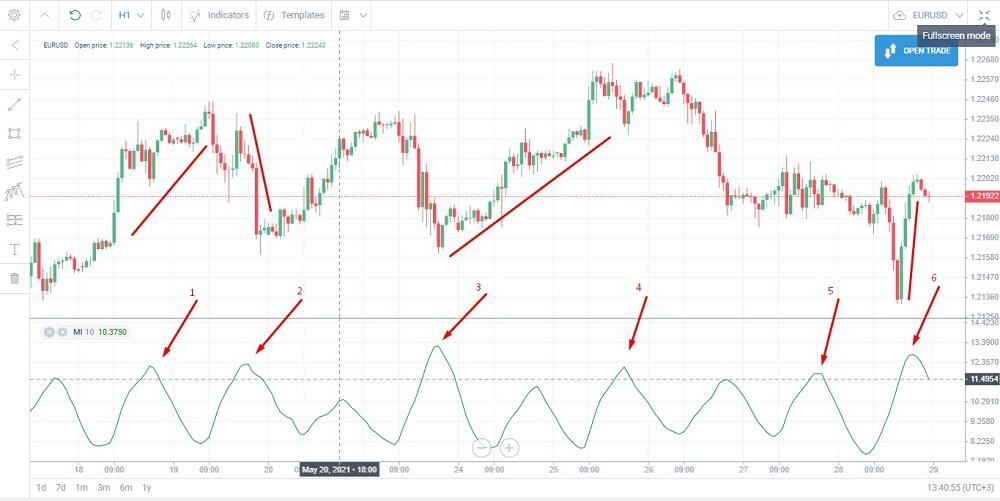
The rising MI line means the increase in the difference between the extreme values, suggesting the increase in volatility. If the indicator reverses in the extreme points, the trend could also reverse. At point 1, the uptrend continues after the local correction, and the signal needs confirmation. At points 2,3, and 6, the signals are clear, and the trend reverses in all three cases. At point 4, the signal is false. At point 5, we do not consider the signal, as the market is trading flat.
The Mass Index is suitable for:
Scalping, swing trading, day trading strategies. It is less commonly used in long-term trading systems. The tool doesn’t work when the Forex market is trading flat.
Timeframes of M15 and longer.
All types of assets.
It is recommended to more experienced traders that know chart patterns and the principles of the combination of trend indicators with oscillators.
Triple Exponential Moving Average (TRIX)
Category: leading
Trend oscillator TRIX is a modification of the exponential moving average smoothed several times. It is similar to the TEMA indicator. Lagging is almost eliminated.
Calculation formula:
ЕМА1 (i) = ЕМА (N, i), where N period.
ЕМА2 (i) = ЕМА (ЕМА1 (N, i))
ЕМА3 (i) = ЕМА (ЕМА2 (N, i))
TRIX = (ЕМА3 (i) - ЕМА3 (i-1)) / ЕМА3 (i-1)
Example of application:
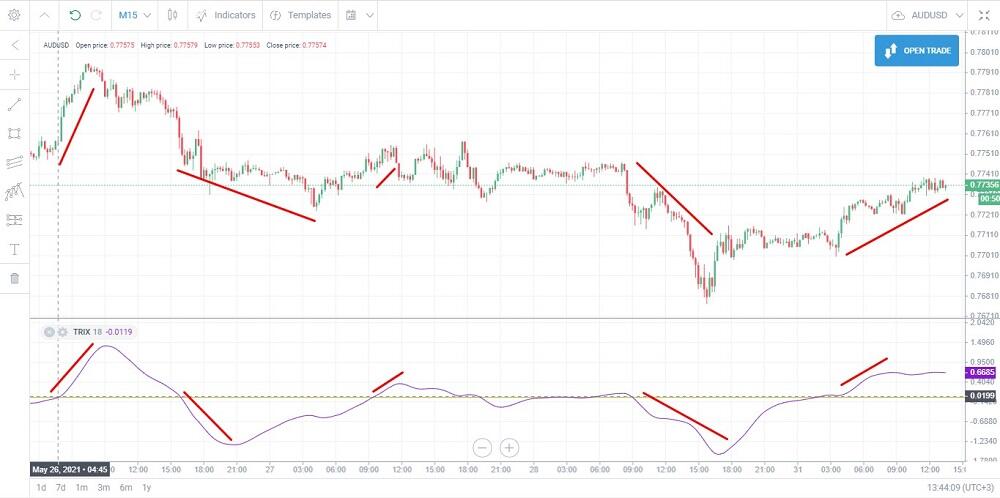
When the TRIX crosses the zero line, it signals a trend reversal. When the indicator is rising, the trend should be up, provided that the signal is confirmed with other tools. The same principle is for the downtrend, only the indicator must be falling.
It is suitable for:
Scalping, short-term, and intraday trading strategies.
For timeframes of М5-Н1.
- Forex market. Several Forex traders prefer this technical indicator since it performs better for major currency pairs.
The TRIX indicator will be of interest to many traders with an active style of trading. It can be used instead of classic oscillators.
Vortex Indicator (VI)
Category: lagging
The Vortex Indicator is a trend oscillator, which identifies the start of the price trend or confirms the current trend. The vortex indicator plots two oscillating lines, one to identify an uptrend (VI+) and the other is to identify a downtrend (VI-).
Calculation formula:
iVIP = High(i) - Low(i-1)
iVIM = Low(i) - High(i-1)
For both lines, the indicator compares the current price and the price of the previous period. The absolute value is taken into account.
sVIP = SMA (iVIP, P)
sVIM = SMA (iVIM, P)
sATR = SMA (ATR, P)
P is the period specified in the settings. SMA abbreviation stands for the simple moving average price. ATR belongs to volatility Forex indicators.
+VI = sVIP/sATR
-VI = sVIM/sATR
Example of application:
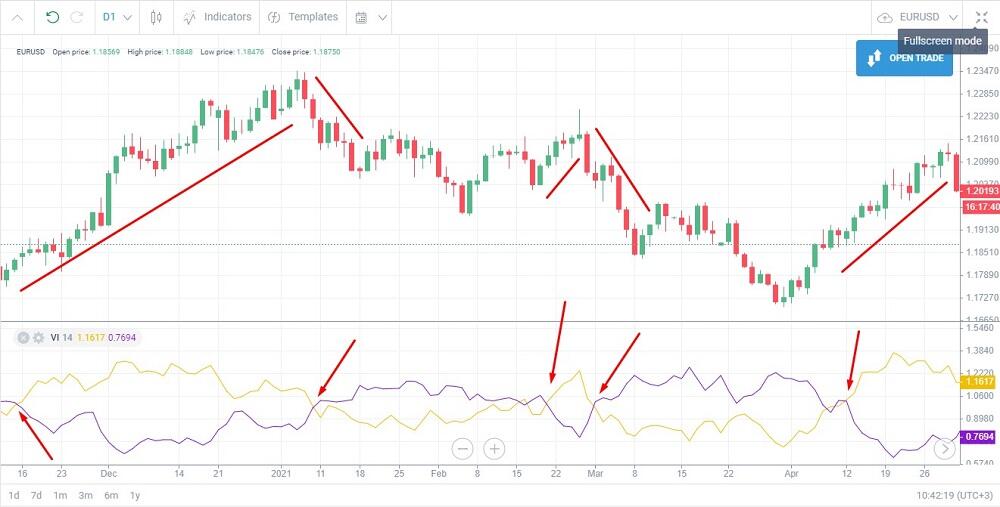
There is a signal when the indicator lines cross. If the VI+ goes up after crossing, the trend is up, if it goes down, the trend is down. The yellow line in the chart is VI+. All signals are relatively accurate if you don’t take into account the moments when both lines form a horizontal interviewing.
It is suitable for:
- Trend following, medium-, and long-term strategies. It sends relatively many false signals, so you apply additional tools.
- Timeframes of H1 and longer.
- Currency pairs, stocks, cryptocurrencies.
It is suitable for any Forex trader with a certain degree of experience who can distinguish between true and false signals of oscillators.
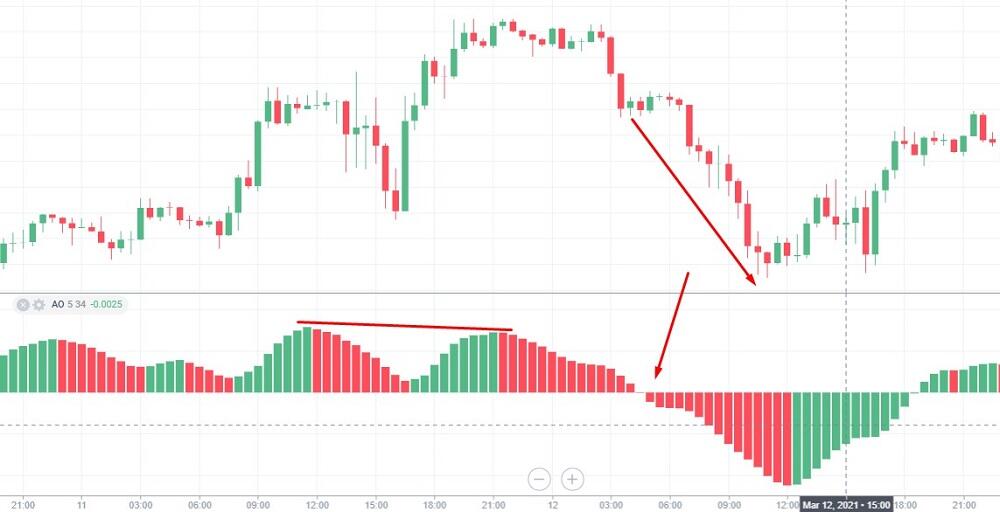
Bill Williams Awesome Oscillator
Category: leading
The Awesome Oscillator is based on the moving averages convergence/divergence. The indicator is displayed as a histogram. The awesome oscillator helps to determine the trend pivot points; it is similar to the MACD indicator, but there are some differences: the AO doesn’t have the signal line. The calculation is based on the median price, not the closing price.
Calculation formula:
АО = SMA (Median Price, 34) - SMA (Median Price, 5)
In the LiteFinance terminal, you can change the period of moving averages.
Example of education:
Signals:
Crossing of the zero line: from top to bottom-sell; from bottom to top – buy trades.
Two peaks: if the highs are getting lower – sell; if the lows are getting higher – buy trades.
A “saucer” pattern to buy. The histogram draws a bottom above the zero line. The first column can be of any colour, the second one is red and lower than the first. The third column is green, higher than the second.
A “saucer” pattern to sell. The histogram draws a bottom above the zero line. The first column can be of any colour, the second one is green and higher than the first. The third column is red, lower than the second.
There are two peaks above the zero line, the second high is lower than the first. The AO line crosses the zero line, it is a sell signal. The higher is the histogram, the stronger is the signal.
The Awesome Oscillator is suitable for:
Any type of strategy: Sometimes, the AO is used as the primary indicator in some strategies. It can be applied to scalping, but it will be less efficient here than in day trading strategies.
Timeframes of М15-М30.
Almost all currency pairs and stock assets. It was originally designed to trade stocks.
The Awesome Oscillator is good for beginners. It is user-friendly and sends straightforward, clear signals. The AO is well combined with the MACD indicator, being used as a confirming tool.
Aroon
Category: lagging
The Aroon indicator is an oscillator used to identify the strength and the direction of the price trend, trend changes. The indicator line is moving between levels 0 and 100. Signals: parallel lines – the Forex market is trading flat, the crossing of the lines means the trend is going to change. If the Aroon up is in the zone of 70%-100%, the trend is up. If the Aroon down is in the zone of 0%-30%, the trend is down.
Calculation formula.
Aroon up: (N - H)/N * 100%
Aroon down: (N - L)/N * 100%
N — calculation period, specified in the settings. H - period (the number of candlesticks) after the absolute high. L — the period after the absolute low.
Example of application:
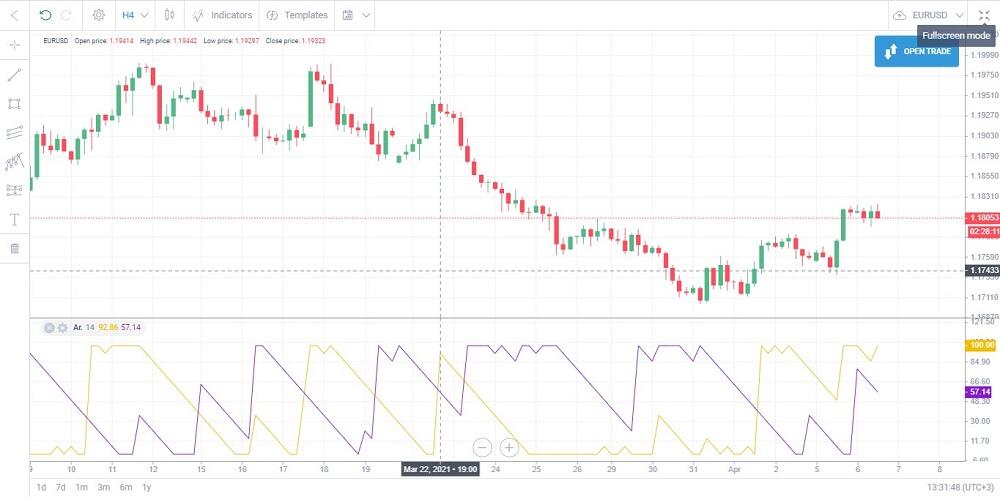
If the yellow line Up is above the blue line Down and is above level 70, the trend is up. If the Up line is above 70 and the Down line is below 30, the trend could change any time. If the Up line reverses, it could mean the trend is exhausting or about to end. The signal to enter a shot or long position is when the lines cross. If the blue line breaks through the yellow one to the upside around level 50, it is a sell signal. The yellow line breaks the blue to the upside, it is a buy signal.
The Aroon indicator is suitable for:
- Defining the end of the sideways trend or the trend change.
- Intraday, medium-, and long-term strategies. Due to the lag and the analysis complexity, it doesn’t work in scalping, in the sideways trend, swing trading,
- Timeframes of H1 and longer.
- All kinds of assets.
Among other technical indicators, the Aroon is suitable for rather experienced traders. The indicator requires the ability to quickly interpret the lines’ location and compare the Aroon data with the price chart. Signals are controversial and need confirmation.
Bulls power & Bears power
Category: lagging
Bulls power & Bears power oscillator was developed by Alexander Elder. It determines the strength of buyers (bulls) vs. sellers (bears). According to Elder, the moving average is an agreement between buyers and sellers when the asset price reaches a specific level over a fixed period, satisfying both parties. The current deviation of the MA means a rise in the power of bulls or bears. In the basic version, the indicator is based on the EMA (13).
Calculation formula:
Bulls power = High - EMA
Bears power = Low - EMA
ЕМА — is the exponential moving average and belongs to Forex indicators. High, Low — extreme values of the current candlestick.
Example of application:
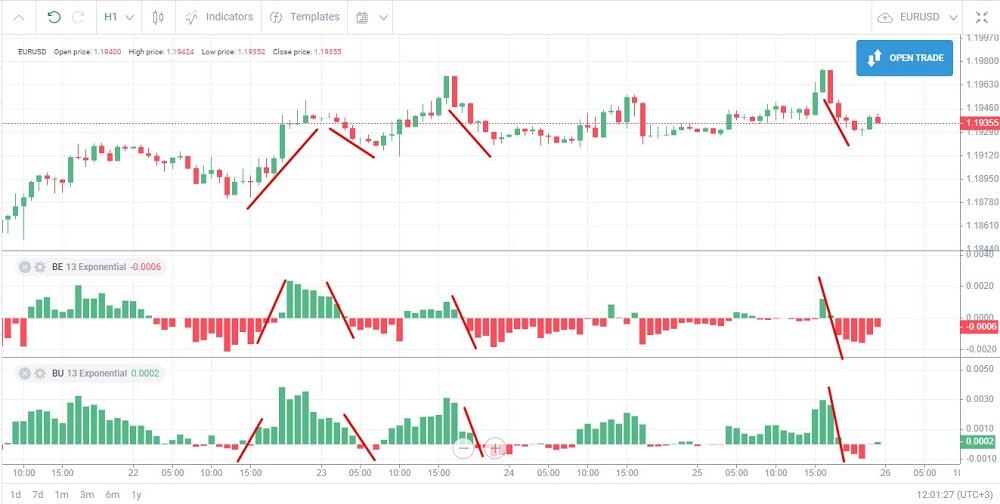
A sell signal in the downtrend appears when both indicators are above the zero line and go down into the negative area. A buy signal in the uptrend appears when both indicators are below zero and start rising, breaking the zero line to the upside.
The indicator is suitable for:
Trend following intraday strategies. Both oscillators are used only in conjunction with trend indicators. The indicator is less efficient in swing trading.
Timeframes of М30-Н1. In short timeframes, there are many false signals because of the lack of a clear trend. In long timeframes, the indicator is lagging.
- Any high-liquid assets. It is not recommended a trading strategy on Forex market with common or exotic currencies.
The Bulls power & Bears power indicator will be of interest to traders who want to master new types of oscillators in manual day trading strategies.
Accelerator Oscillator
Category: leading
The Accelerator Oscillator (AC) is an indicator developed by Bill Williams that helps a Forex trader to gauge the acceleration of the current momentum. The AC is based on the idea that the price change results from the changes in the general momentum. The Oscillator indicates the change in the momentum direction, which will be followed by the trend change.
Calculation formula:
Median Price = (High + Low)/2
АО (Awesome Oscillator) = SMA (Median Price, 5) - SMA (Median Price, 34)
AC (Accelerator Oscillator) = AO - SMA (AO, 5)
Example of application:
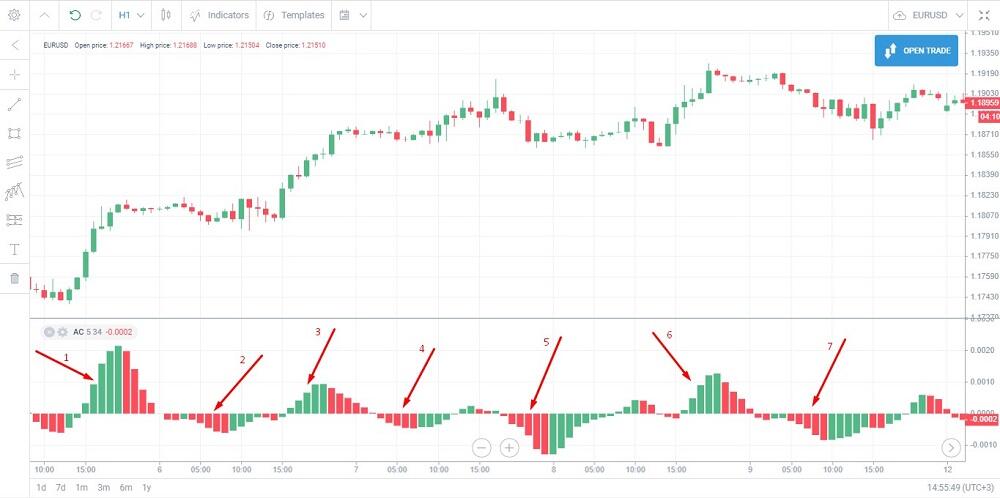
Signals: a buy signal appears when the columns rise above the central zero line. The breakthrough of the zero line is not a signal itself. You can put an order when there are at least two columns of the corresponding colour (green is for a buy, red – sell). The indicator, used alone, sends quite many false signals and it is not considered to be a good option for a trading entry. For example, signals 2, 4, and 5 in the screenshot are false.
The indicator is suitable for:
Trend following strategies, swing trading. It is less effective when the Forex market is trading flat.
Timeframes of M15 and longer.
Any assets, including stocks and cryptocurrencies.
The Accelerator Oscillator is recommended to beginner traders as a good additional tool in combination with common oscillators.
Detrended Price Oscillator
Category: leading
Detrended Price Oscillatoris designedfor analyzing short-term trends. It is not a prediction indicator, it doesn’t define the trend. The indicator signals local short-term corrections within long-term trends. It fits well with the Elliott wave theory tools.
Calculation formula: horizontal zero line – moving average.
DPO(i) = Close(i) - SMA(Close, (i/2 = 1))
Close is the closing price of the current candlestick, the SMA is a simple moving average for a period specified in the settings.
Example of application:
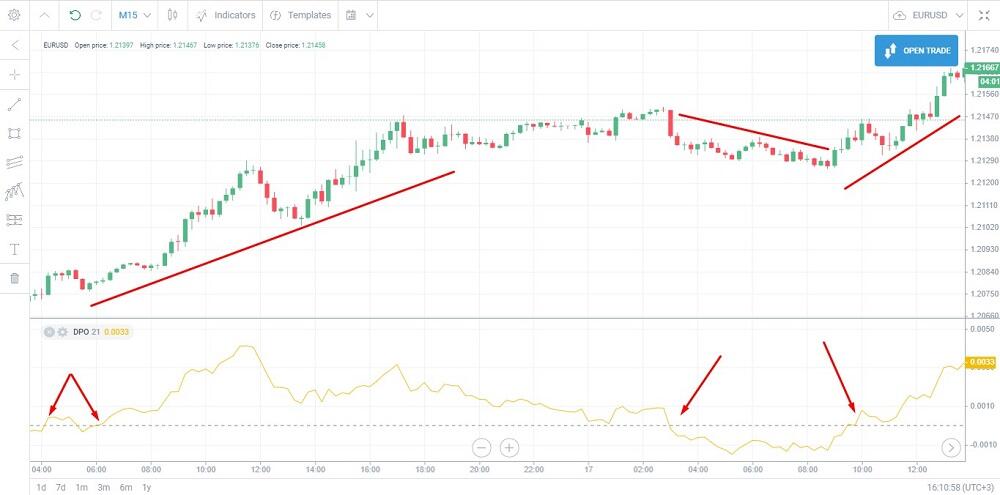
The signal appears when the oscillator line breaks through the zero line. If the line goes up, it is a buy signal; if the indicator goes down, it is a sell signal.
It is suitable for:
- All types of short-term strategies: scalping, short-term swing trading.
- Timeframes of М5-М15.
- All types of trading instruments, including cryptocurrencies.
The tool can be recommended to more experienced traders, who prefer reversing positions or locking.
Chande Momentum Oscillator
Category: leading
Chande Momentum Oscillator measures the rate of the Forex market momentum change. Unlike other oscillators, the CMO moves in the range of – 100 and +100. The overbought and oversold zones are above 50 and below -50 correspondingly.
Calculation formula:
СМО = (P(u) - P(d)) / (P(u) + P(d)) * 100%
P(u) is the difference between the current and the previous close. P(d) is the absolute value of the difference between the current and the previous candlestick.
Example of application:
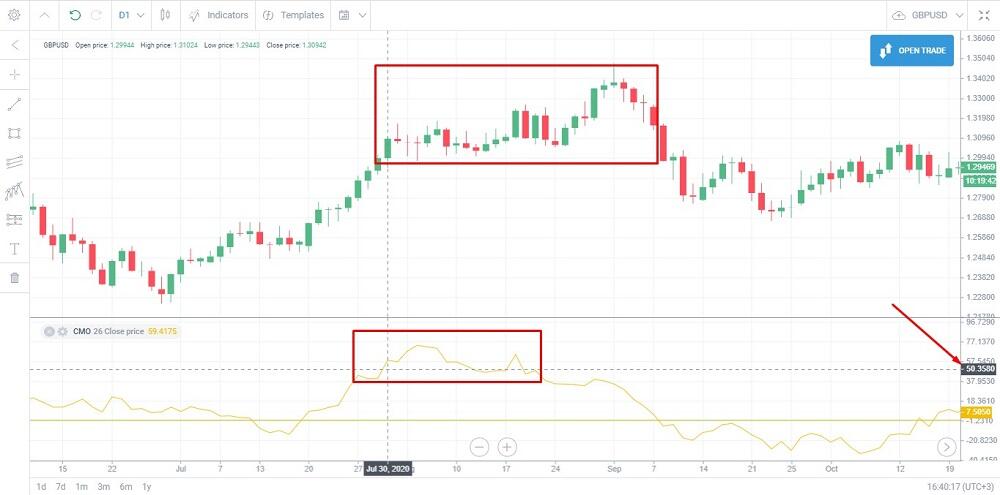
When the line of the Forex indicator is above +50 or below -50, the trend could reverse or start trading flat. The longer is the timeframe, the longer should be the indicator period.
It is suitable for:
Trend following intraday and long-term strategies. It is similar to the Relative Strength Index in terms of application.
Timeframes of Н4-D1.
- Trading on Forex market, including cross currency pairs. It is less commonly used in stock or commodity markets.
Fisher Transform Oscillator
Category: leading
Fisher Transform Oscillatordetermines the trend pivot points, converting prices into a Gaussian normal distribution.
Calculation formula: the calculation is based on the price extremes of the previous days in the daily timeframe, applying the Fisher transformation to the relationship between the current price and the previous price extremes.
Example of application:
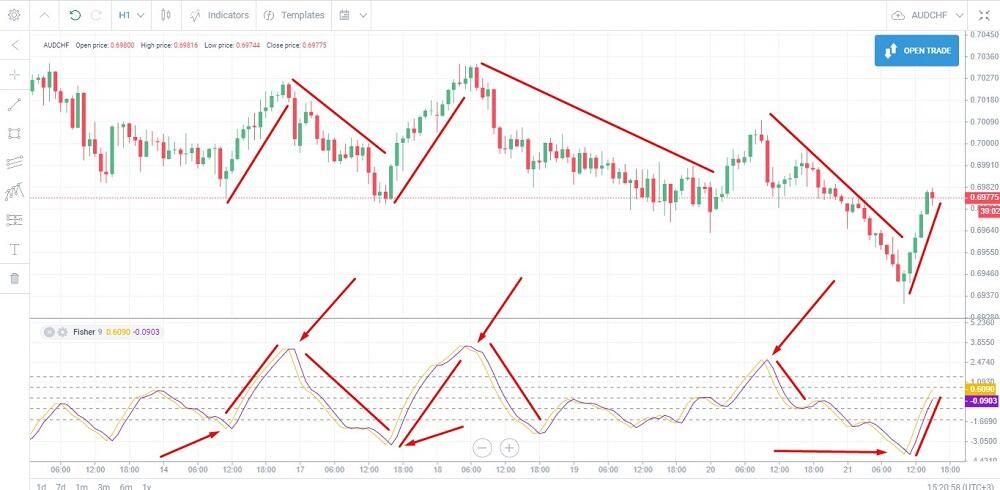
The indicator line plots around the zero line, which is marked with a horizontal dotted line. Other dotted lines on either side of the zero level indicate possible key points. The location of the lines changes according to the period specified in the settings. One of the signals is the location of the oscillator line relative to the levels of 1.5 and -1.5. If both lines are above 1.5 and start turning down, it is a sell signal. If both lines are below -1.5 and start turning up, it is a buy signal.
It is suitable for:
- Day trading trend strategies. It is less commonly used for intraday swing trading.
- Timeframes of М30-Н1. The indicator developer doesn’t recommend using the tool in the timeframes longer than H4 because of many false signals.
- Any trading assets.
Ultimate Oscillator
Category: lagging
The Ultimate Oscillator is a range-bound indicator with an absolute value that fluctuates between 0 and 100. The UO defines the market overbought and oversold zones by comparing the current prices with the prices of three previous periods.
Calculation formula: it has a complex formula based on the weighted moving average.
Example of application:
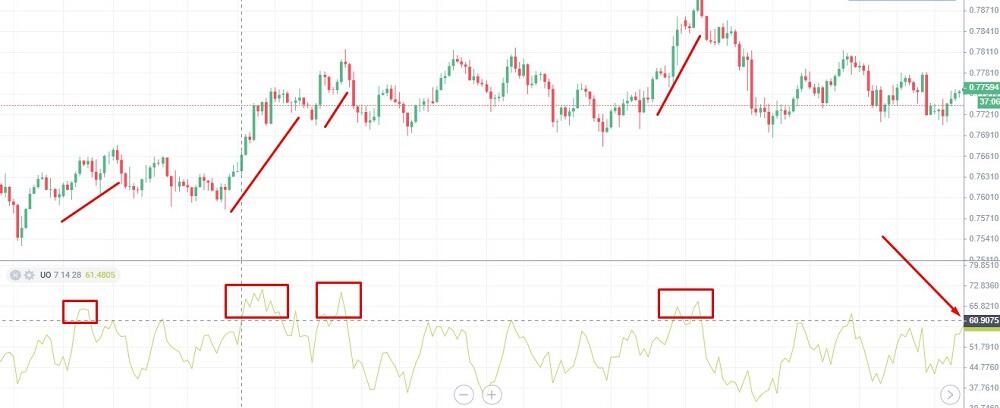
Signals: the reversal in the overbought/oversold zone towards the middle of the range is an entry signal. Another signal is the divergence.
It is suitable for:
- Long-term strategies.
- Timeframes of H1 and longer.
- Currency pairs.
The UO is recommended to professional traders who want to get familiar with new technical analysis tools and imply efficient techniques of personal finance. The Ultimate Oscillator sends quite many false signals and needs constant optimization of settings. It could perform quite well if you can correctly interpret the signals, using additional tools, like chart patterns and trend-following tools.
Volatility Indicators
Volatility indicators measure how far an asset strays from its mean directional value for a particular period specified in the settings. It is used in trend following and channel strategies with the analysis of multiple timeframes.
- Trend following indicators. The volatility level of a small range of candlesticks is analyzed in longer timeframes. In shorter timeframes, the distance covered by the price at the current moment is estimated.
- Channel indicators. The channels are built along with the extreme points of the price deviation from the average value. The wider the channel, the higher the volatility. A narrow channel in currencies’ charts means that the Forex market is trading flat. Channel trading systems could be divided into two types of strategies. The first type is based on the channel breakout and the beginner of the trend. The second one suggests the price return to the center of the channel after the rebound from the channel borders.
Examples: Bollinger bands, ATR, standard deviation.
Bollinger Bands
Category: lagging
Bollinger Bands is a channel indicator combining the features of the oscillator and a volatility tool. It is consisted of an upper and a lower band. The indicator is composed of three simple moving averages, the distance of which is measured according to the standard deviation formula. The Bollinger Bands indicator is employed in channel strategies of two types, the channel breakout trend following strategy that happens at the upper band of the chart and the price rebound from the channel borders towards the median price value, that takes place at the lower band.
Calculation formula:
ВВ middle line = SMA (Close, N)
SMA - the arithmetic average of the closing prices for the period specified in the settings.
ВВ channel lines = SMA +/- StdDev
StdDev = (Close - (SMA, N))2N
Close is the closing price of the candlesticks from the sequence. (SMA, N) is the arithmetic mean of the closing prices of the sequence. N is the period.
Example of application:
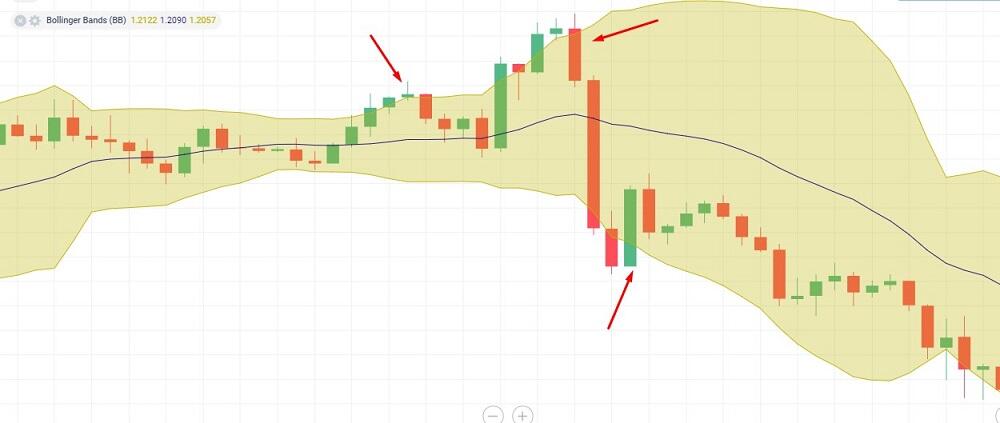
A narrow channel with short candlesticks suggests a sideways trend. If the candlestick breaks out the channel, the price is likely to move towards the channel or its opposite border. The rule doesn’t always work, so you need to estimate the potential of the reversed trend using additional tools, oscillators, and Price Action.
Bollinger Bands indicator is suitable for:
- Any trading strategies, including trading flat. It is recommended for trend-following channel trading systems.
- Timeframes of H1 and longer.
- Currency pairs with a high or medium volatility level. It is less commonly used in stock trading.
The Bollinger Bands indicator can be recommended to traders with any skill level. It can be used by beginners for training after they get familiar with moving averages.
Bollinger Bands Width
Category: lagging
The Bollinger Bands Width is a technical indicator derived from the Bollinger Bands that shows the distance between the upper and the lower standard deviations of the BB indicator. It is a line, located under the price chart, whose minimum value is always more than 0. The higher is the market volatility, the greater is the distance between the Bollinger bands, and the higher is the BBW value.
Calculation formula: the difference between the upper and the lower band lines of the BB indicator.
Example of application:
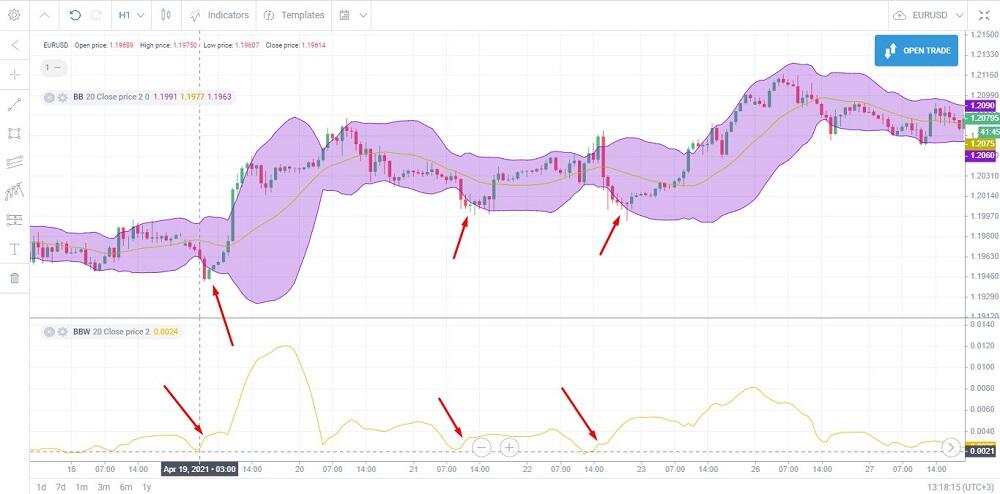
We draw a horizontal BBW level along two or three lows that are located in the lower band in the zoomed-out chart, the indicator most often rebounds from the line. We open a position in the trend direction following one or two candlesticks after the rebound up. False signals occur; therefore, it is advisable to open trades only when the BBW rebound was preceded by a narrow flat channel.
The BBW is suitable for:
Any trend following strategies, based on channel indicators. It is recommended to add the BBW with the Bollinger Bands indicator.
Timeframes of H1 and longer.
Currency pairs with a high level of volatility.
The BBW is good as an additional tool, suitable for traders of any skill level who work with channel strategies.
Keltner channel
Category: lagging
Keltner channel draws the channel of price movements relative to the central EMA line. The Keltner channel doesn’t follow the price, thereby showing the continuation of a strong price movement at the moment of the channel border breakout.
Calculation formula:
TP (Typical price) = (High(i) + Low(i) + Close(i))/3
Range = High(i) - Low(i)
True Range(i) = Max (High(i), Close(i-1)) - Min (Low(i), Close(i-1)
Middle Line = EMA (TP,n) - exponential moving average of the typical price
Up Line = Middle Line + k*EMA(True Range(i), n)
Down Line =Middle Line - k*EMA(True Range(i), n)
k is the deviation factor (multiplier), specified in the settings, i is the current price, n is the period, the number of candlesticks analyzed.
Example of application:
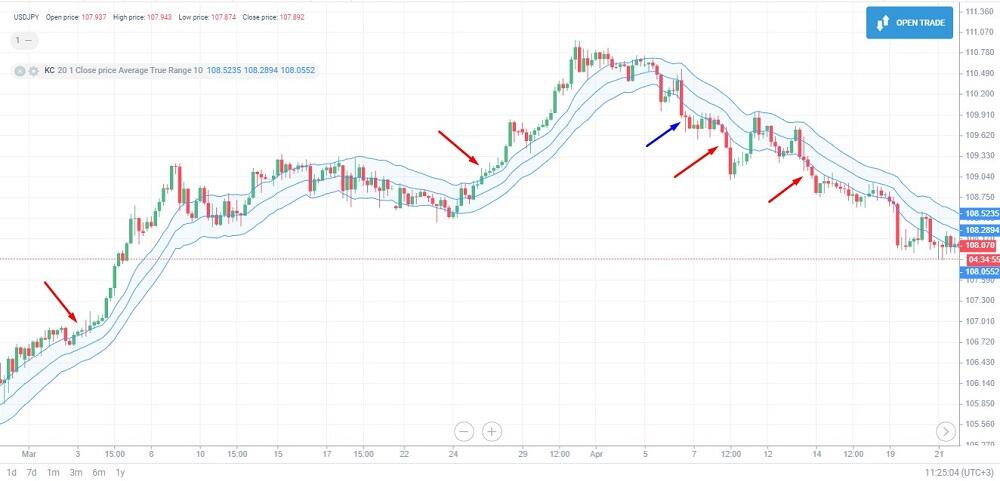
An early signal is the channel breakout. A stronger signal is when the body of the closed candlestick is beyond the channel. If a part of the candlestick is within the channel, expect another candlestick that should be of the same colour. The position is closed when the strong trending movement exhausts or when the price goes back into the channel. Several Forex traders prefer this indicator to help them pick up short local movements of one-three candlestick and the long-term trends. In the above chart, red lines mark winning signals, blue ones – false.
It is suitable for:
- Trend following channel, strategies, and swing trading. The Keltner channel doesn’t work in trading flat, it is not recommended for scalping. The indicator is often used in intraday strategies, less often – in long-term strategies.
- Timeframes of M30 and longer.
- Any type of trading assets: currency pairs, cryptocurrencies, stock CFDs, and commodities.
The Keltner channel is recommended to a beginner Forex trader as one of the top Forex indicators. Unlike other similar tools, the Keltner channel doesn’t follow the price immediately, so its signals of the channel’s breakout are easily and accurately interpreted. It can be the primary tool of a trading system. The tool fits well with oscillators, confirming the signal — for example, the Relative Strength Index.
Average True Range
Category: lagging
The ATR indicator measures the volatility level. It is not bound by a fixed range, the current values are compared with the previous ones. The higher are the average true range values, the higher is the volatility, the faster the price changes. The ATR doesn’t indicate the trend direction.
Calculation formula: The indicator calculates the TR:
Version 1 = High(i) - Low(i)
Version 2 = Close(i) - High(i-1)
Version 3 = Close(i) - Low(i-1)
ATR = Moving Average (TR, m)
MA is averaging all values, TR is the largest absolute value of the obtained differences, m is the calculation period.
Example of application:
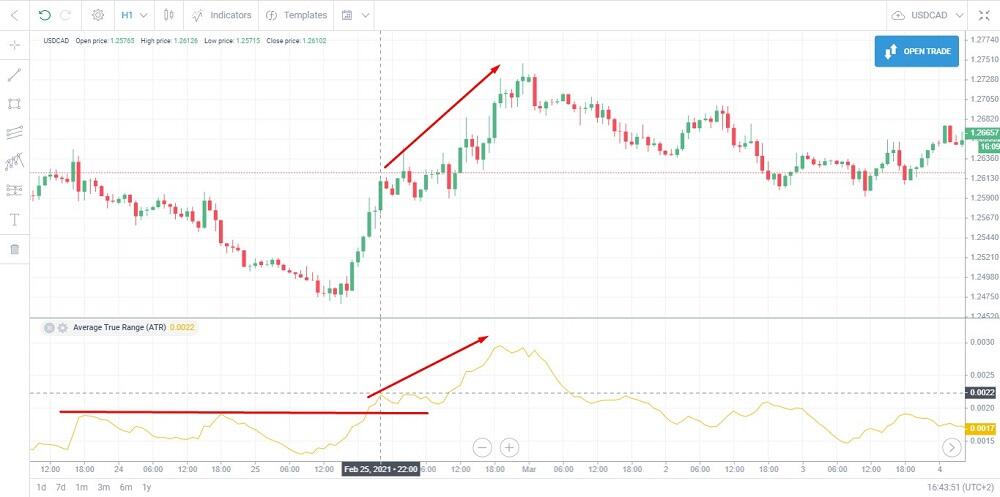
A sharp rise in the average true range value means an increase in volatility. The angle of the trend movement becomes close to 90%, the length of the candlestick bodies increases.
The ATR is suitable for:
Analysis of the longer timeframes to define the volatility level and switch to a shorter timeframe. It is often used in daily timeframes in the strategies, which imply trading opportunities in H1-H4 timeframes.
Scalping, swing trading, fundamental trading in any type of assets.
The average true range indicator is not very useful for newbies due to low information content and narrow scope of application.
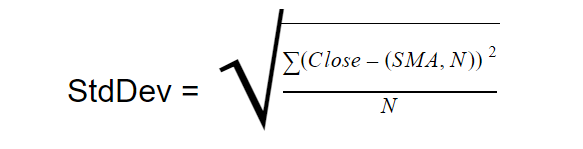
Standard Deviation
Category: lagging
The Standard Deviation is a volatility indicator, measuring the rate of the price deviation from its mean value. The higher is the SD value, the greater is the current volatility, and the stronger is the trend. The longer the indicator line rises, the more likely is the trend to reverse.
Calculation formula:
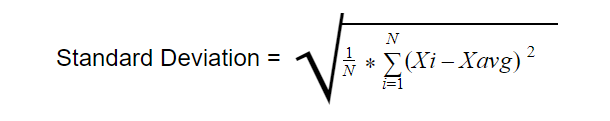
N is the indicator period, the number of the candlesticks analyzed. X is the closing price of each candlestick in the range. Xavg is the arithmetic mean of the sample prices. The formula is the standard deviation.
Example of application:
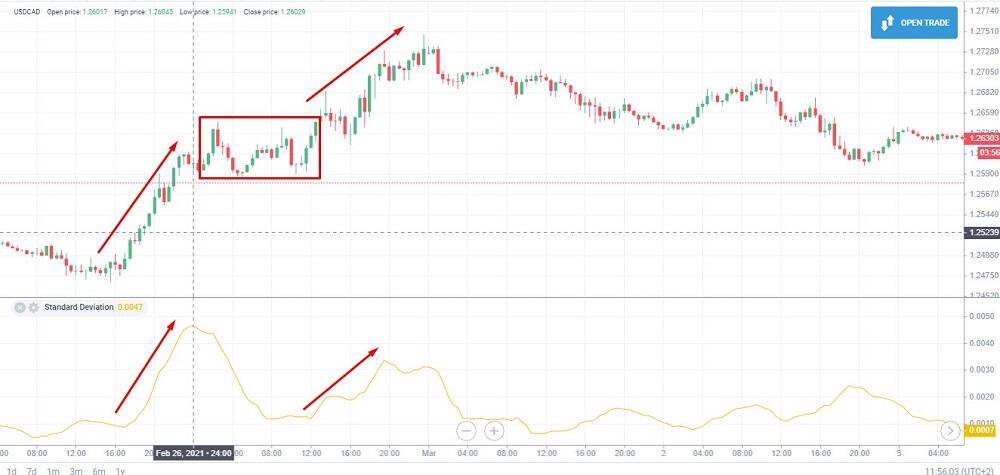
The increase in the Standard Deviation confirms the uptrend. When the volatility declines, there appears the consolidation zone, which should be followed by an uptrend, accompanied by the rise of the SD value. The tool doesn’t indicate the trend direction.
The Standard Deviation indicator is suitable for:
- Fundamental trading strategies, scalping, swing trading.
- Timeframes of М30-Н1.
- Highly volatile assets: cryptocurrencies, major currency pairs.
The tools will be of interest to beginner traders, who learn to spot the rise in market volatility and try to employ trading strategies based on the volatility changes. It is rarely used by many traders.
Chaikin Volatility
Category: lagging
Chaikin Volatility Indicator measures the volatility based on the range between extreme price values. The tool is based on the idea that the volatility declines during a correction and increases when the trend starts. The indicator is displayed as a line in the separate window. If the indicator’s value is above 0, the current volatility is greater than that taken as a basis; if it is below 0, the volatility is lower than the reference point taken as a basis. By "taken as a basis" the average daily volatility value is meant.
Calculation formula:
HL(i) = High(i) - Low(i) - the difference between the current high and low of the candlestick.
HL(i-n) = High(i-n) - Low(i-n) - the difference between the high and low of period n candlesticks ago.
CHV = (MA(HL(i),n) - MA(HL(i-n),n)) / MA(HL(i-n),n) *100%
MA(HL,n) - moving average for a period n, specified in the settings.
It is suitable for:
- Trend following strategies, to confirm the signal. The tool could be used to determine the trend pivot points.
- Timeframes of М30-Н1. It doesn’t work in scalping due to the lag. The tool is not recommended for daily timeframes, as it doesn’t take into account the gap. It performs well applied to day trading strategies.
- Any trading assets, including stocks and cryptocurrencies.
The Chaikin Volatility Indicator will be of interest to traders who are familiar with other volatility indicators. Compared to the ATR, the Chaikin Volatility indicator has more variants of the interpretation of the signals. Therefore, it could seem a bit complex for beginners.
Volatility Ratio
Category: lagging
The Volatility Ratio indicator determines the moments when the price moves out of its average true range, which means a breakout point. The indicator moves in the range of 0.01-1. If the VR exceeds 0.5, the trend may reverse.
Calculation formula: the VR is calculated in several stages. The price extremes of several candlesticks are compared, and one of the variants, corresponding to the conditions set, is chosen.
The Volatility Ratio is suitable for:
Strategies based on determining the moments when the trend exits the average range, which could signal the following trend reversal.
Timeframes of H1 and longer.
- Stock assets. It is less commonly used to trade Forex.
The Volatility Rate indicator will be of interest for fundamental analysts that are into trading stock assets. The tool is used only for the market analysis in combination with primary and confirmation tools.
Chande Kroll Stop
Category: lagging
Chande Kroll Stop isa trend-following indicator that measures the price momentum and the average true range of an instrument's volatility. The Chande Kroll Stop is mostly used to set the stop loss and identify a sideways trend. The tool helps to avoid exiting a trade too early or holding it too long, determining an optimal stop loss level.
Calculation formula: The indicator uses the ATR values in the formula and the multiplier.
- ATR calculates the average value for a period (P). By default, it is 10 candlesticks.
- The stop-loss level is calculated as the highest high and the lowest low for a period (P).
- A stop loss for a long position is calculated by subtracting ATR, a multiple of x(1), from the highest high. X is specified in the settings.
- A stop loss for the short position is calculated likewise, but here, the х*ATR parameter is added to the lowest low for nine candlesticks (Q)
Example of application:
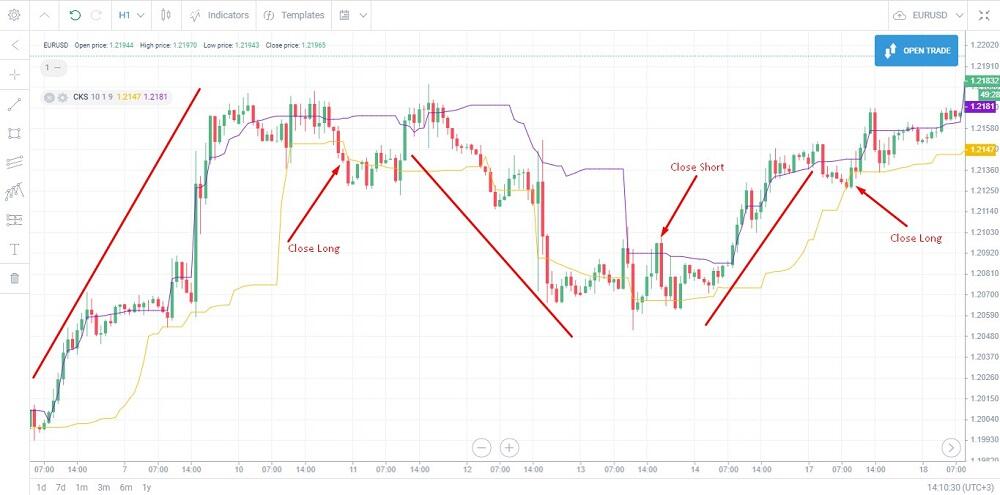
Signals: when both indicator lines make a narrow corridor, the market is trading flat. The indicator is applied to search for entry signals. If the candlestick fully or partially closes above the upper line, exit a short position. If the candlestick closes below the lower line, exit a long trade.
The indicator is suitable for:
Trend following short-term and day trading strategies as a tool to determine the stop loss level. It doesn’t work in scalping.
Timeframes of М15-Н4.
- Any trading assets. It is most commonly applied as a trading strategy on Forex market.
The Chande Kroll Stop will be of interest to professional traders, who can use the Price Action patterns with the indicator signals. The tool is not recommended to newbies because the signals could be confusing and difficult to interpret.
Volume Indicator
The Volume indicators are the tools, whose formula takes into account trading volumes in addition to the averaged price values for each part of a period specified in the settings. Trading volume is a measure of how much of a given asset has traded in a period of time at the financial markets. Compared to common Forex averaging indicators, trading volume indicators more accurately distribute the weight of each part depending on the transaction volume. In Forex, volumes mean the number of price ticks within a specified period. These indicators are used in trend-following strategies. They are more suitable for the stock rather than Forex market.
Example: VWAP, OBV.
Chaikin Oscillator
Category: leading
The Chaikin Oscillator is a derived oscillator based on the difference of the moving averages of the Accumulation/Distribution indicator. The tool can be described by several principles.
If the level of the current closing price reaches a higher value than the average one for the previous close values’ of the period, then the market is in the accumulation stage. If the current close is lower than the average value, there is distribution in the market.
The price growth is accompanied by the volume increase. If the volume of transactions is growing slower than the price, the price rise will soon end. The asset can’t rise in price if the trade volume doesn’t increase.
The Chaikin Oscillator helps to monitor the market volumes, and so one could determine tops and bottoms.
Calculation formula:
CHO = EMA (A/D, N) - EMA (A/D, M)
EMA (A/D) is the exponential moving average of the AD indicator. N and M are periods, whose default values are N=3, M=10.
A/D(i) =((Close(i) - Low(i)) - (High(i) - Close(i)) / (High(i) - Low(i)) * Volume(i) + A/D(i-1)
Close, High, Low are candlestick prices, i is the current candlestick, (i-1) is the previous candlestick. Volume(i) is the trade volume of the current candlestick.
The Chaikin Oscillator is suitable for:
- Trend following intraday strategies. It doesn’t work for scalping.
- Exchange-traded assets, such as stocks and derivatives. It is less commonly applied to trading cryptocurrencies.
- Medium-, and long-term strategies.
The Chaikin Oscillator will be of interest to a professional stock trader, who can efficiently understand advanced knowledge of personal finance . The tool is rarely applied in Forex trading, as there are difficulties with the consolidation of real trade volumes.
Volume-Weighted Average Price (VWAP)
Category: lagging
The VWAP is one of the moving averages derived indicators that takes trading volumes into account when averaging prices. VWAP is the abbreviation of the volume-weighted average price. The greater the trade volume of a particular candlestick, the greater its weight in the total result. The work algorithm is similar to that of the moving averages.
Calculation formula:
VWAP = SUM(P*V)/SUM(V), where
P means typical price, determined by the formula: (High + Low + Close)/3. V means volume.
Example of application:
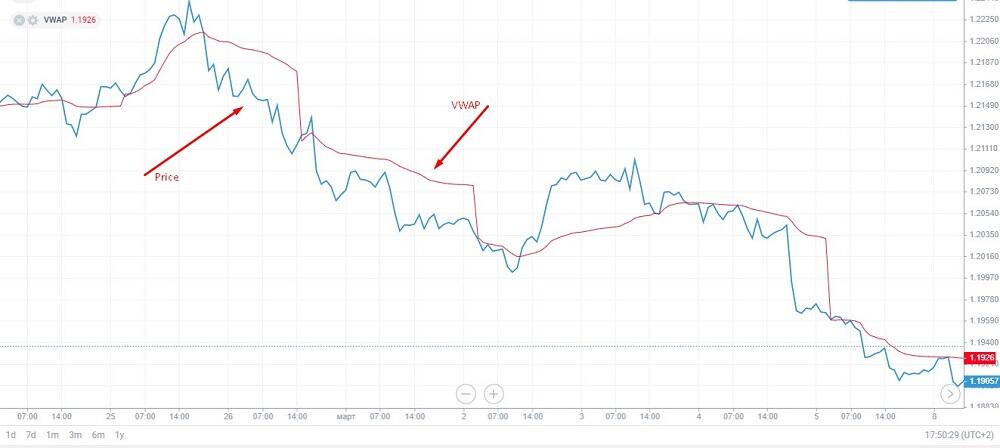
The price has been below the VWAP line for a long time, which means a downtrend. The longer the price stays below the indicator’s average price line, the more likely is the trend to reverse up. The signal of an upside reversal is when the price breaks through the VWAP line to the upside. The opposite signal, when the price has been above the VWAP, means an uptrend. The longer the price stays above the indicator line, the more likely the trend is to reverse down. When the price chart breaks through the indicator’s average price line to the downside, the trend is to turn down.
The VWAP is suitable for:
- Stock trading if there is an opportunity to see the trade volumes online. For Forex trading, there is a simplified VWAP version with limited functions.
- Timeframes of М30-Н1 and longer.
- Medium-, and long-term trend following strategies
- Medium-, and long-term trend following strategies.
The VWAP will be of interest to professional stock traders. Beginner traders had better use of the VWAP Forex indicator, which has only one line. The tool fits well with common moving averages.
On-Balance Volume (OBV)
Category: leading
The OBV indicator measures the volume changes along with the price change. It is displayed as a line under the price chart, the OBV line is not limited by any range. The tool is used to confirm potential trading entry signals. If the indicator is rising, the trend is confirmed. If the price chart is going ahead of the OBV, the trend is not confirmed by the trade volume; it means the trend is exhausting.
The OBV calculation formulais as follows: if the current closing price is higher than the last closing price, the current obv is added to the previous value. When the current closing price is lower than the last closing price, the current volume is subtracted from the prior value.
Example of application:
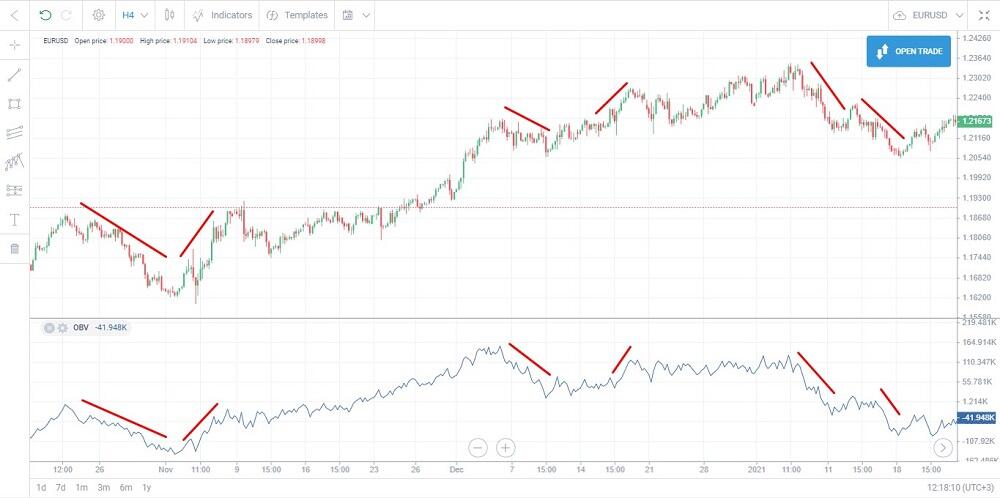
The OBV is a comparative tool. The sharp movement up or down relative to previous periods, confirming the trend, is taken into account. The horizontal movement of the indicator is ignored.
The OBV indicator is suitable for:
- Trend following indicator strategies. It confirms the signal, together with the moving averages, performs well when there is a divergence.
- Timeframes of Н1-Н4 and longer.
- Trading stock assets, if there is access to the information on the current stock volumes in real-time.
The OBV is recommended to traders who prefer a stock market financial instrument. It is less useful in Forex and performs worse than other oscillators in terms of signal accuracy and interpretation.
Volume Price Trend Indicator (PVT)
Category: lagging
The PVT indicator measures the balance between a security's demand and supply. It takes into account a percentage increase or decrease, rather than simply adding or subtracting the volume based on the fact that the current price is higher or lower than the prices of the previous days. The PVT confirms the trend similar to the OBV indicator and has a similar formula.
PVT calculation formula:
PVT=((CLOSE(i) - CLOSE(i-1)) / CLOSE(i-1)) * VOL (i) +PVT (i-1)
Close — closing price, Vol — trade volume.
Example of application:
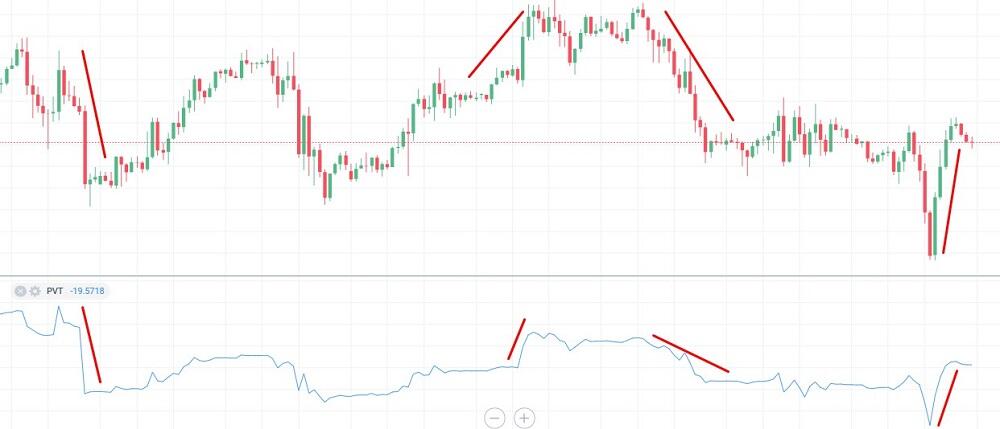
The PVT growth means that the price movement is accompanied by an increase in the cumulative trade volume. The upward movement of the indicator line confirms an uptrend; the downward movement of the indicator line confirms a downtrend.
The PVT indicator is suitable for:
Trend following strategies, which consider trade volumes. It is used as a complementary tool together with trend indicators and oscillators.
Timeframes of H1 and longer.
- Trading stocks. It is less commonly used in Forex as a trading strategy since it lacks of real-time information on trade volumes.
The PVT will be of interest to professional traders who use long-term strategies in stock markets, and have an advanced understanding of personal finance.
Volume Rate of Change
Category: lagging
The VROC indicator measures the rate of the volume change. The change of the VROC value means the following: the longer the trend lasts, the more traders are willing to enter the market, and the higher are the trade volumes. However, high trade volumes could also mean that the market is considered overbought/oversold, and the trend could reverse soon. The VROC is used to determine false breakouts: if the price highs/lows are not accompanied by volume growth, the price extreme is false. There could be a correction instead of the trend continuation.
Calculation formula:
(Volume(i) - Volume(i-n))/Volume(i-n) * 100%
Volume(i) — trading volume of the current candlestick, Volume(i-n) — trading volume of the candlestick n periods ago.
The VROC is suitable for:
- Trend following strategies. It is less commonly used in swing trading and doesn't work in scalping.
- Timeframes of М30-Н1 and longer.
- Trading in the stock market where there is access to the real trade volumes data. The tool is rarely used in Forex, as the tick volume is taken into account, i.e., the general amount of the trades entered in both directions, rather than stock market volume.
The VROC is suitable for professional traders who prefer stock assets.
Money Flow Index (MFI)
Category: lagging.
MFI is a momentum indicator that measures the flow of money into and out of a security over a specified time frame. The signals interpretation is similar to the Relative Strength Index (RSI) but also considers trade volumes. Primary signals are divergence and the overbought/oversold state.
Calculation formula:
Typical price (ТР) = (High + Low + Close)/3
MF = TP * Volume
If the current typical price is higher than the TP of the previous candlestick, the money flow is positive. If the current TP is lower than the previous one, the money flow is negative. In the settings, there is specified time frame for which all positive flows and all negative flows are summed up separately.
MR = Sum of positive flows / Sum of negative flows
MFI = 100 - (100/(1-MR))
It is suitable for:
- Intraday, medium-, long-term strategies. It is not recommended for scalping, trend-following indicators.
- Timeframes of М30-Н1 and longer.
- Stock trading assets, like equities, indexes, derivatives. It is less commonly used in Forex, as here only tick values are taken into account, rather than volumes.
Force Index Indicator
Category: lagging
Force Index is an oscillator that measures the bullish force of price increases and the bearish force behind price declines. It shows the investors’ interest in the trading asset. If the indicator increases, the price is rising compared to the previous period. It means that the number of investors and the amount of trades are rising, and the trend is likely to continue.
Calculation formula:
Force Index = Volume(i) * (МА(N,i) - MA(N,i-1))
Volume(i) is the trading volume of the current candlestick. MA(N,i) is the moving average of the current candlestick for period N. MA(N,i-1) is the moving average of the previous candlestick. You can also specify the MA type and the price type in the Force Index index.
The Force Index is suitable for:
- Trend following strategies. It helps to determine the moments of trend strengthening, potential points of the trend end. The FI confirms the trend strength, spots corrections; therefore, it could be used in swing trading.
- Timeframes of М30-Н1 and longer.
- Trading in the stock market, equities, futures, options. It is rarely applied to Forex trading, as there are no data on real volumes on the OTC market.
The Force Index indicator could be recommended to professional stock traders that have a more sophisticated trading plan, and a better knowledge of personal finance.
Entry indicators
In this section, we will consider the best indicators for determining the optimal market entry points.
Fibonacci retracement
Category: leading
Fibonacci retracement levels are the support and resistance levels that indicate the end of a local correction and the return to the main trend. The calculation is based on the statistical patterns and the psychology of the majority.
Calculation formula: The indicator is based on the golden ratio principle. The grid is built between the local high and low; the distance accounts for 100%. The section is divided into zones separated by levels from 23.6% to 76.4%. These are the golden ratio levels.
Example of application:
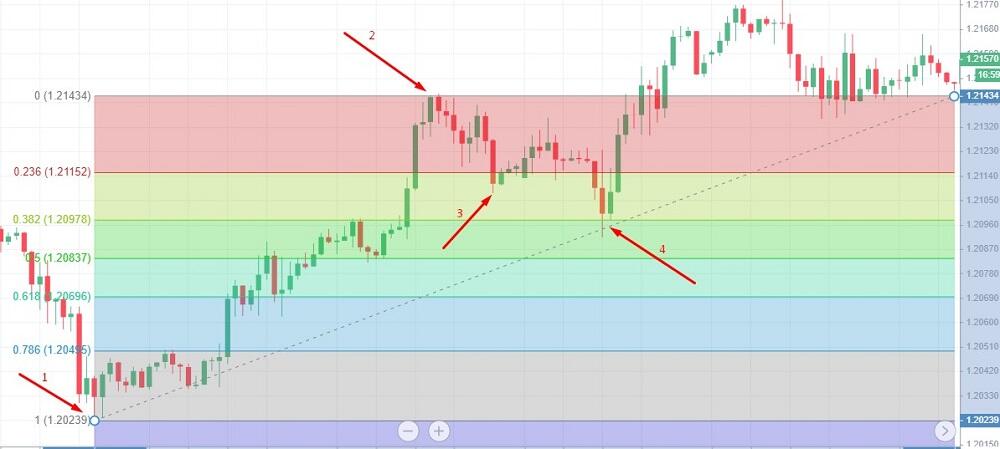
The Fibonacci grid is placed according to points 1 and 2. The first counter-trend movement breaks through point 3 (level 0.236), but the trend resumes almost immediately. We can set a stop loss at a level a little lower than the 50% level. The second correction ends at point 4 (0.382), this level is one of the key ones. Here, if the trend turned up, one could have added up to the trade. At the golden ratio when the price goes up, the take-profits for 50% of both trades are set at the 0% level. The remaining 50% are protected with a trailing stop corresponding to the distance between points 0.236 and 0%.
The Fibo indicator is suitable for:
Scalping and swing trading. Orders are put when the steady trend resumes after a correction. Following the golden ratio principal is also good in trend-following strategies, where Fibo indicator as a tool spots the trend reversal when the correction exceeds 50% of the range.
Any timeframes. Depending on the investors trading plan Fibo is better at determining the entry and exit points in the H1 timeframes and longer ones, where the distance between the closest levels is at least 8-10 pips. The market analysis can be performed in any timeframes.
Any assets. The Fibo levels are often used in trading currency pairs, cryptocurrencies, and stock assets.
As we mentioned before, Fibonacci retracements indicator follows the golden ratio principal. Thus, it can serve both as a primary tool in a trading system and a complementary indicator to confirm the signals and predict future price moves. It is often used as a forecasting indicator. The Fibo indicators are among the best trading indicators recommended to beginners.
Note that there is the Auto Fib Retracement indicator among the built-in tools in the LiteFinance trading terminal. It automatically builds the Fibonacci retracement levels according to the most recent highs and lows and updates them when a new price extreme appears. It is good to identify the support and resistance levels, monitor the change in the retracement levels, and so on.
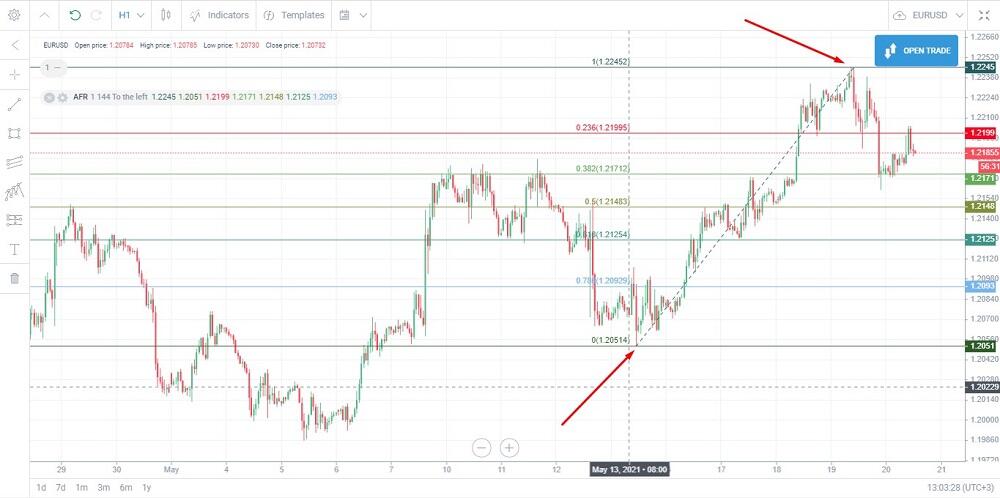
Forex price extremes indicators
The price extremes are complementary tools, determining potential trend reversal points. Such Forex indicators effectively complement the graphic chart analysis, highlighting the primary highs and lows to build key levels. Such trading indicators are used to draw the support and resistance levels and determine the potential trend pivot points.
Pivot Point
Category: complementary
In classical interpretation, the indicator determines the potential trend reversal points. The Pivot Point indicator belongs to Forex indicators and is used to visually identify the key levels and the levels to set stop loss and take profit.
Calculation formula: the indicator determines the most important price extreme values for a period specified in the settings.
Example of application:
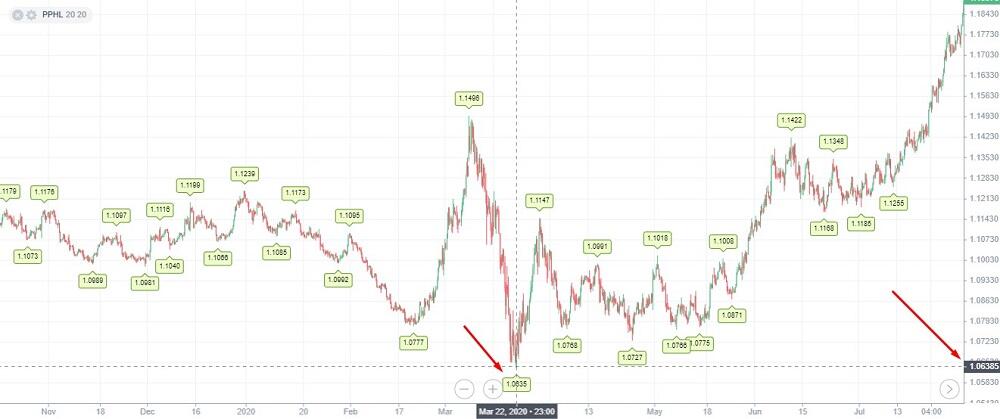
The indicator displays the extreme price values in the chart. You can reduce the number of values in the settings and leave only the key values. The Pivot Point is used to draw the support and resistance levels, a quick scan of the price range.
The Pivot Point is suitable for:
Any assets. It is equally efficient as a trading strategy with currency pairs on Forex market, cryptocurrencies, as well as stock assets.
Any timeframes. It is an information indicator, so timeframes do not matter.
Any trading strategies. It works both in scalping and long-term strategies.
The Pivot Point can be recommended to traders of any level of skills. This is an information, complementary tool that fits well with any technical indicators.
Support and resistance
Category: complementary
The Support and Resistance indicator draws the key levels where the trend could reverse.
Calculation formula: the Support and Resistance indicator is based on Bill Williams’s Fractals indicator, which identifies a Fractal pattern as a sequence of 5 candlesticks, where the middle candlestick is the highest/lowest compared to the previous and the following bars.
The indicator is suitable for:
- Any type of strategy. It draws horizontal levels across the key highs and lows. It helps to define the optimal levels to set the market and pending orders, take profits and stop-losses.
- Any trading assets, Forex and stock exchange.
- Any timeframes. It sends more accurate signals in the timeframes of М15-М30, where there is less market noise, and price swings are not that sharp.
The support and resistance indicator doesn’t require any specific knowledge or experience, so it is suitable for all traders. It will be of use to either a technical or fundamental analyst who prefer graphic analysis.
Best Indicators for Day Trading
Day trading means trading within one day, and closing positions before the swap is charged. Day trading also includes short-term scalping, but most commonly, it means trading timeframes of М15-Н1, with the position holding time up a few hours.
Best intraday trading indicators:
Trend following indicators. Alligator, the Ichimoku cloud, moving averages, ADX, and so on. All trend indicators will work in day trading; they will indicate the potential sideways trend start and beginning of a trending movement. Implementing such tools on your trading plan will help you make profits from a movement of several candlesticks.
Channel indicators. Bollinger Bands, Keltner Channel, Donchian Channels. In the timeframes of М30-Н1, traders have time for analysis, the influence of the market noise is eliminated. Channel indicators send more accurate signals in the medium-term timeframes.
Oscillators. MACD line, Relative Strength Index, CCI, and stochastic are utilized in combination with trend indicators to get stronger signals.
- Information indicators. ZigZag, Market Sentiment, volatility indicators. These are complementary tools indicating the expected trend direction and strength.
The advantage of intraday trading is that almost all indicators can be used in such a type of trading strategy, provided the settings are optimized.
Less commonly, day trading is interpreted as trading in the daily timeframe, which could be referred to as a long-term trading strategy. The same trend following indicators do well in the D1 timeframes. There are a few notes:
- Information indicators perform worse in the D1 timeframes. The market Sentiment indicator is efficient in a short-term period, as long-term forecasts are strongly influenced by fundamental factors.
- There are more false signals sent by oscillators.
Best Indicators for Stock Trading
Options for trading financial instruments: stocks CFDs, and equities.
- Stocks CFDs. CFDs are traded in the Forex market, which is the OTC market. Here, the same financial instruments as with currency pairs’ trading can be used, known as Forex indicators. The feature of the stock market is longer trends, compared to currencies, and deeper drawdowns. Therefore, you could focus on trend indicators and important levels, for example, the Fibonacci retracements and extensions. Parabolic SAR, MACD indicator, Alligator perform quite well in trading individual stocks CFDs.
- Equities. Trading securities in a stock exchange. Here, in addition to standard tools, you can use volume indicators:
- VWAP – volume-weighted average price. It indicates more accurately averaged prices considering the trade volume of each candlestick.
- On Balance Volume indicates averaged cumulative volume for a specific period.
In the stock market, these indicators reflect the real numbers and volumes of trades. In Forex, volume indicators show only the number of ticks, the number of price changes, as you can obtain total statistics in the OTC market. So, volume indicators are not efficient in trading CFDs.
Best Indicators for Swing Trading
Swing trading is a short-term strategy based on the idea to put an order in the trend direction at the end of the correction.
The algorithm of a swing trading system:
- Expect the beginning of the trend. The trend is best to recognize when the sideways trend is finished. The price reversal is less commonly used as a signal.
- Expect the first price reversal. Once the counter-trend movement ends, and the price returns to the trend, enter a trade.
- Close the position in two steps. Take 50% of the profit when the price reaches the most recent high or low, depending on the trade direction. Protect the remaining 50% with trailing stop or exit the trade when the next correction starts.
Best indicators for swing trading.
- Fibo retracement levels. The indicator builds the key levels where the trend could reverse.
- ADX. The ADX indicator shows the strength of bulls and bears; it can indicate an acceleration or a slowdown of the price movement.
- Oscillators like CCI, RSI, stochastic indicator. They show the market saturation with buy or sell volumes (overbought and oversold states). For example, a downward correction occurs when the market enters the upper band of an uptrend and oscillators are in the overbought zone. In this case, one should not put an order at the correction end as the price can continue moving down.
You can learn more about swing trading systems, indicators, and signals in the article devoted to swing trading.
Best Indicators for Option Trading
There are two types of options: binary options and stock options. Trading binary options is a simplified version of the CFD trading when the trader should predict if the future price will be up or down relative to the current values. Stock options are security derivatives.
1. Binary options. The choice of the financial instrument depends on the trading system. In general, you can use the same indicators as in Forex trading.
The best indicators for options trading:
- Moving Averages. The combination of moving averages can be used in almost any trading strategy, from swing trading to long-term analysis. A good example of the MA combination is the Alligator.
- Oscillators: stochastic, RSI, CCI. They are used to confirm trend trading and benefit from high profits.
2. Stock options. There will work indicators suitable for stock trading.
You can also use:
- TD Sequential. It is a trend trading indicator that spots reversal patterns and predicts a long-term trend.
- Money Flow Index. This is a volume Forex indicator similar to the Relative Strength Index (RSI).
- PVT. This is another volume indicator, mostly employed in the stock market.
Best Indicators for Scalping
Scalping is short-term high-frequency trading, which means entering many trades and holding them for a few minutes. The trading timeframes are M5-M15, minimum spreads, and high volatility are important for a scalper. The trend direction hardly matters, a scalper quickly exits a trade and enters an opposite one if the price goes in the opposite direction. It is possible to trade in a sideways trend if the price amplitude in the range allows covering spread.
Scalping indicators should be leading, ignore the price noise, and should not repaint.
Best Forex indicators for scalping:
Spread indicator. Spread is important for a scalper. The narrower is the spread, the sooner the Forex trader can close a position, making profits from any price movement. The spread Forex indicator shows the spread widening amid the fundamental volatility.
Heiken Ashi chart.The chart eliminates the market noise, smooths the price swings, and is more convenient.
- The Ichimoku cloud. This Forex indicator measures the trend strength and direction. It signals trading flat, sends rare but accurate signals.
You can learn more about scalping trading strategies and multiple indicators that can be used in the Forex market simply by reading the article devoted to scalping in Forex.
Best Indicators for Crypto Trading
Crypto trading means trading cryptocurrencies against the USD. The feature of the cryptocurrency market:
- High volatility – 2%-3% per day is the norm.
- High spread, slippages.
- High sensitivity to fundamental factors.
Indicators, based on mathematical algorithms, perform worse in the cryptocurrency market than in Forex market when trading currency pairs. Any pattern or regularity could be broken by fundamental factors, market-makers’ actions, statements of the regulators and central banks, media people.
Best Forex indicators for cryptocurrency trading:
- Fibonacci levels, support/resistance levels, chart patterns. Since cryptocurrency quotes are largely driven by fundamental factors and mass psychology, indicators analyzing traders’ behaviour work better.
- Market sentiment indicators. It shows the majority opinion, whether the market is bullish or bearish.
- Spread indicator. The tool helps not to miss the beginning of the spread widening due to the growth of volatility.
One can well apply basic technical Forex indicators, but the signals should be confirmed with fundamental and chart analysis.
Best Forex indicators: Summary
A short summary is presented in the table below. There are listed only the 15 most popular, accurate, and best indicators for Forex trading that can be implemented for any trading plan. These tools can be applied by traders of any level of trading experience. You can read a detailed overview of each tool by following the links given in the sections devoted to different types of multiple indicators.
| Indicator | Category | Type | Suitable for | How to use | Parameters |
|---|---|---|---|---|---|
| МА | Lagging | Trend Following | Day Trading | Long: Fast MA crosses the slow one to the upside. Short: Fast MA crosses the slow one to the downside. | (9), (21) |
| ТЕМА | Leading | Trend Following | Scalping, Day Trading, Long-term Trading | Long: 1-2 consecutive candlesticks close above ТЕМА. Short:1-2 consecutive candlesticks close below ТЕМА. | (9) |
| Alligator | Lagging | Trend Following | Day Trading, Long-term Trading | Long/Short: MA start going apart | (21, 13, 13, 8, 8, 5) |
| MACD | Lagging | Trend Following | Day Trading, Long-term Trading | Long/Short: histogram columns grow/decline; MACD lines are going apart in the trend direction. | (12, 26, 9) |
| Parabolic SAR | Lagging | Trend Following | Day Trading, Long-term Trading | Long: PSAR is under the price chart. Short: PSAR is above the price chart | (0,02, 0,02, 0,2) |
| ADX | Lagging | Momentum | Day Trading, Long-term Trading | Long/Short: DI+ goes up/down after the crossing. Additional signal: primary line goes up, which confirms the trend strength (both uptrend and downtrend). | (14, 14) |
| CCI | Leading | Momentum | Day Trading, Long-term Trading, Swing Trading, Reversal Trading | Long/Short: CCI reverses towards the center of the range after entering the overbought/oversold zone. | (20) |
| RSI | Leading | Momentum | Day Trading, Long-term Trading, Swing Trading, Reversal Trading | Long/Short: RSI reverses in the overbought/oversold zone towards the center of the range. | (14) |
| Stochastic | Lagging | Momentum | Day Trading, Long-term Trading, Swing Trading, Reversal Trading | Long: Stochastic indicator is in the oversold zone below 20 and turns up. Short: Stochastic is in the overbought zone above 80 and turns down. | (14, 3, 3) |
| Fibonacci retracement | Leading | Enter | Swing Trading, Scalping | Long/Short: enter a trade in the primary trend direction when the correction ends at the Fibo levels. | Default |
| Chande Kroll Stop | Lagging | Volatility | Day Trading | Used to set a stop loss | (10, 1, 9) |
| ATR | Lagging | Volatility | All Types | Long/Short: an increase in the ATR value means the volatility rise. Enter a trade in the trend direction. | (14) |
| BBW | Lagging | Volatility | Channel Trading | Long/Short: BBW rebounds up from its support level. Enter a trade after one or two candlesticks in the trend direction. | (20, 2) |
| Keltner Channel | Lagging | Volatility | Channel Trading | Long/Short: a candlestick closes completely beyond the channel. Enter a trade in the trend direction. | (20, 1) |
| On-Balance Volume | Leading | Volatility | Day Trading, Long-term Trading, Swing Trading | Long/Short: clear increase or decline of the indicator values means uptrend or downtrend, respectively. | Default |
FAQ on Forex Trading Indicators
Any. The matter is not in the tool but in the ability to use it skillfully: identify signals, combine different tools with chart patterns, and fundamental analysis. For example, there are complex trading systems employing 3-5 combined author’s indicators, digital indicators. In order to spot a potential trading entry, a technical or fundamental analyst may choose to combine profitable trading strategies based on standard technical indicators. The best trading indicators are selected for each particular trading strategy, depending on the trader’s style and goals.
- Basic Forex indicators. In MT4, there are 30 standard technical indicators and 31 chart objects. In MT5, there are 38 indicators and 44 chart objects. LiteFinance trading terminal provides 45 technical indicators and 25 chart objects.
- Custom indicators Forex. There are hundreds of custom indicators. Some of them are the versions of basic tools, upgraded and modified basic tools. Other custom indicators are original tools based on standard algorithms or unique developments. You can get acquainted with original indicators on the TradingView website or on the MQL5 website, the MT4/MT5 developer. Also, in MQL5, in the freelance section, you can order programmers to write an indicator code based on the original trading algorithm and an input data set.
Moving Averages in different modifications. Price averaging tool using the arithmetic mean method with or without weighing individual periods. MAs are applied in:
- MA-based strategies. They are based on the crossing of the MAs with different periods.
- Complex indicators. For example, Bollinger bands that consist of higher and lower bands.
- Combination with technical indicators, when smoothing by the moving average method is required, for example, with the VWAP indicator.
All indicators could be accurate in different market conditions. Recommendations:
- Choose the indicator parameters, so that you can obtain as many accurate signals as possible.
- Test the indicator on a demo account in all kinds of market situations, determine the moments when the signals are the most accurate. For example, there are indicators that do not work in trading flat or in minute timeframes.
- Use the MT4 strategy tester. Test the indicator on different types of trading assets and different timeframes, analyze the backtesting statistics.
- Add some complementary tools to confirm signals.
Almost all Forex indicators define entry and exit points. Examples:
- Channel indicators: If the trade is entered within the Keltner channel or Bollinger bands following the rebound from the channel borders, the exit signal will appear when the price reaches the middle of the channel or the opposite border.
- Trend following indicators. The entry signal of the Alligator is when the indicator lines are moving apart. When the lines start meeting together, it is the exit signal.
- Oscillators. The entry signal of stochastic appears when the indicator goes outside the standard range. The exit signal is when the indicator hits the opposite border, 20 and 80.
- Trend strength indicators. When the ADX value is 50 and more, it means that the trend is exhausting, and the Forex trader is time to exit a trade.
These are the complementary tools that confirm the signal. The algorithm of the search of an entry or exit signals:
- The signal is defined based on the primary indicator. The signal means that one or several conditions are met. For example, when the indicator crosses the price chart from below up.
- When you have found the signal, you enter a trade once the signal is confirmed.
- Indicators that fit well with your trading system.
- Indicators that you understand and feel convenient to trade with.
- Indicators that send the most accurate and profitable signals at the right time in your trading strategy.
- Attach the indicator to the chart in Metatrader 4 and Metatrader 5. Enter the Insert-Indicators menu. Select the needed tool in the tab.
- Attach the basic indicators in the LiteFinance personal profile. Press the Trade button and the left corner of the terminal window. Open the chart of the needed asset and click on the Indicators tab.
- Install additional indicators in Metatrader 4 and Metatrader 5:
- Paste the template into your computer.
- Open the tab for adding templates to the data catalog in the File menu on the top.
- Go to MQL4/5 – Indicators directory. Paste the indicator template to the folder.
- Restart the platform.
Any indicators designed for timeframes of H1 and longer. In long-term strategies, it is better to use trend-following tools, volatility indicators, and trend-strength indicators. They will help you define the moments of the trend exhaustion. Oscillators are less efficient in daily timeframes. You can also add information indicators:
- Spread indicator. Indirectly signals the moments of a sharp imbalance in the market.
- Market sentiment. The tool measures the number of orders, volumes and shows the opinions of the majority in the particular timeframe.
- Indicator of trading sessions. Some assets have higher volatility during a particular trading session.
Types of combinations:
- Forex indicators and oscillators. Make profits from a trending movement by determining its beginning and confirm the entry signal with oscillators. Oscillators will also help you spot potential trend reversal points.
- Forex trend indicators and chart analysis. Find strong levels, enter trades when the price breaks them out or rebounds. Refer to reversal patterns, confirming the trend reversal.
- Either you are a technical or fundamental analyst, each trading system is individual, and you should not limit yourself by only suggested options. Find your own best combination of Forex indicators that will be most convenient to trade for you.
For short-term trading in timeframes of М15-Н1, you can use any Forex indicators and oscillators. For example, you can try a combination of CCI, RSI, MACD line and moving averages, the Ichimoku cloud, and so on. The intraday trend is well defined by Alligator, a combination of moving averages with different periods or TEMA. In channel strategies, there will work EMAs with the same periods but different types of prices, High, Low. The Keltner Channel will perform well together with the Price Actions patterns, offering a potential profitable trading entry.
Technical indicators that take trade volume into account - VWAP, On-Balance Volume. Such tools consider the trade volume of each candlestick in averaging, so they reflect the market situation more accurately. Use the volume indicators together with trend tools and oscillators.
Indicators that measure the degree of the dominance of bulls or bears, the market volatility:
- ATR is the volatility indicator that measures the price extremes of the two subsequent candlesticks. The higher the volatility, the stronger the market momentum.
- ADX is a complex indicator that measures the change in the power of bulls or bears and the trend direction.
- Alligator is a trend indicator based on moving averages. The wider the distance between the MAs, the stronger the price momentum. When the lines are meeting together, the trend is exhausting.
In addition to common Forex indicators and oscillators, you can use volume indicators in trading future and other stock market assets.
For scalping, the best tools are leading indicators, which are hardly influenced by the market noise, and can work in minute timeframes and in the sideways trend. You can also combine leading and lagging indicators. For example, you can use the Bollinger Bands, and a popular momentum indicator such as RSI or stochastic, in conjunction. There are trading systems based on the Ichimoku cloud. It would be good to use the spread indicators as an additional tool.
- For stock options, you can use volume indicators, Forex indicators. You can also order a professional to develop an original indicator on the MQL5 website.
- For binary options, you can use the same indicators as in Forex trading. Everything depends on the trading system.
- All Fibonacci tools. The Fibo is between technical indicators that draws psychological levels, where the correction is expected to end. The Fibonacci extension shows the expected new high/low of the trend after correction ends.
- The ADX measures the strength of bulls or bears, featuring the dominance of buyers or sellers.
- With technical indicators like RSI and stochastic. If the oscillator line is close to the range borders, the correction could develop into a trend.
An arrow indicator can be considered as the best Forex indicator choice when it is developed especially for your investment strategy in order to help you exploit all the trading opportunities that may appear. Thus, you should perform multiple tests to find a tool that will send the most accurate signals without repainting. Enter the freelance section on the mql5.com website and create an order to add arrows to the indicator code at the moment of the signal formation. Thus, you will obtain the arrow indicator that will suit your trading strategy.
Do you have any questions? Let us discuss them in the comments! If you know any good trading indicators, write in the comments, and I will provide an overview!
The content of this article reflects the author’s opinion and does not necessarily reflect the official position of LiteFinance. The material published on this page is provided for informational purposes only and should not be considered as the provision of investment advice for the purposes of Directive 2004/39/EC.